Free Access
Fig. 6
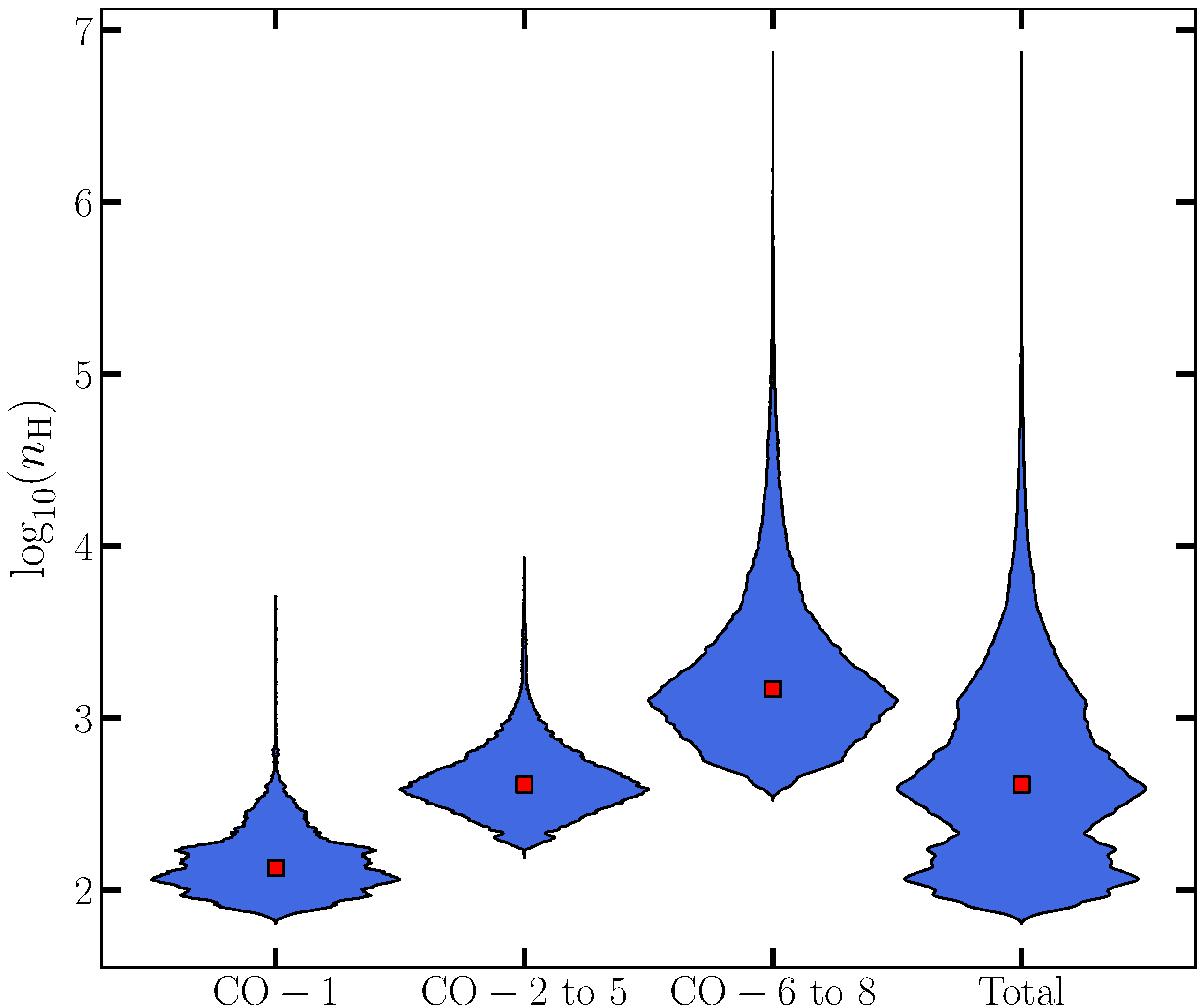
Violin plot showing the PDF of the approximate gas volume density nH, comparing the contributions of the three groups of CO clusters discussed in the text (CO-1, CO-2 to 5, and CO-6 to 8) to the PDF of the total data set.
Current usage metrics show cumulative count of Article Views (full-text article views including HTML views, PDF and ePub downloads, according to the available data) and Abstracts Views on Vision4Press platform.
Data correspond to usage on the plateform after 2015. The current usage metrics is available 48-96 hours after online publication and is updated daily on week days.
Initial download of the metrics may take a while.