Fig. 5
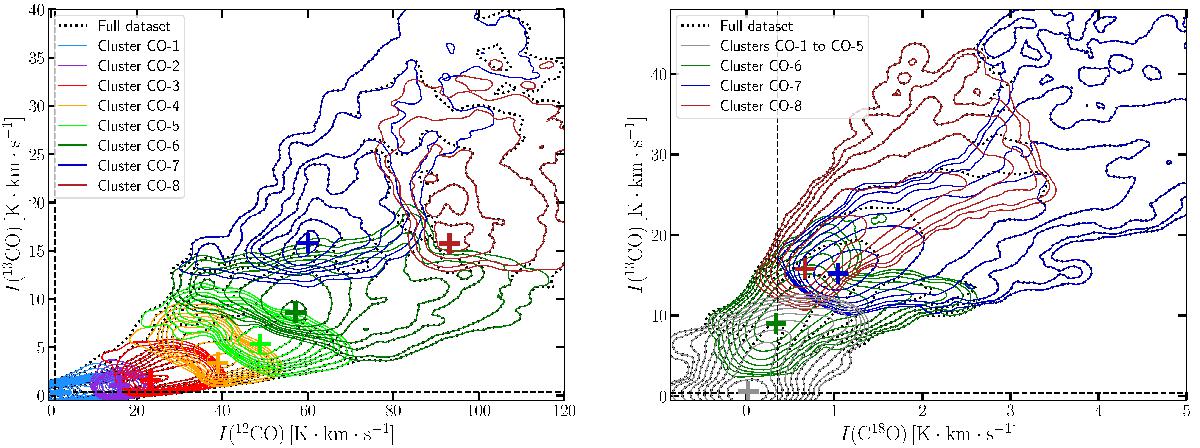
Contour plot of the 2D PDFs of 13CO vs. 12CO (left), and 13CO vs. C18O (right). The PDFs of the total dataset are shown as black dotted contours, while the PDFs of the individual clusters are shown as solid contours coloured according to the colour coding of clusters in Fig. 2. On the right panel clusters CO-1 to CO-5 have been grouped (grey contours) for better readability. The thin vertical and horizontal dashed lines show the median 4σ noise levels, while the coloured crosses show the positions of the PDF maxima for each cluster.

Current usage metrics show cumulative count of Article Views (full-text article views including HTML views, PDF and ePub downloads, according to the available data) and Abstracts Views on Vision4Press platform.
Data correspond to usage on the plateform after 2015. The current usage metrics is available 48-96 hours after online publication and is updated daily on week days.
Initial download of the metrics may take a while.