Fig. 3
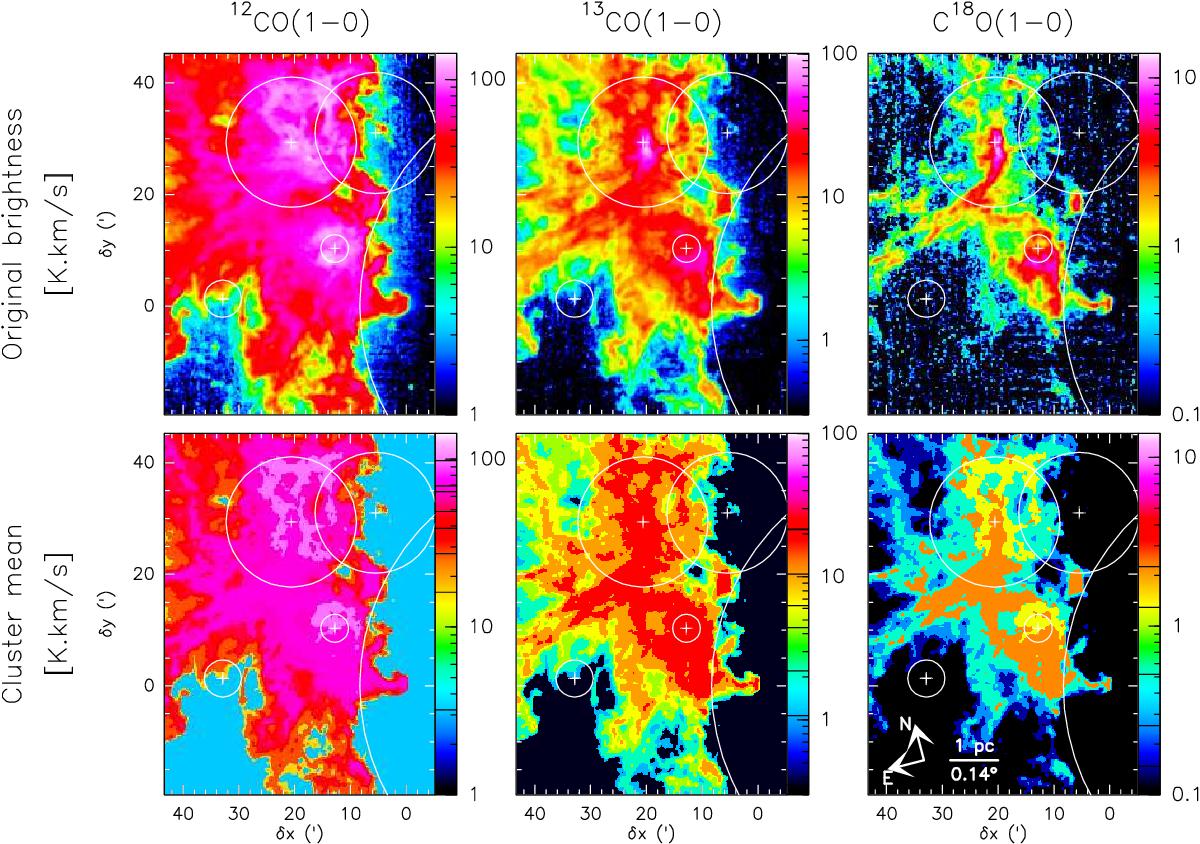
Comparison of the original intensity spatial distribution (top row) with the mean intensity computed for each cluster separately (bottom row). The colour scales are identical for the top and bottom rows, but they differ from one column to another. The levels shown on the bottom colour lookup table represents the mean values of the cluster intensities. The clusters were defined using the 12CO, 13CO, and C18O (1–0) lines. The circles show the typical extensions of the Hii regions and the crosses show the position of the associated exciting stars (see Pety et al. 2017, for details).
Current usage metrics show cumulative count of Article Views (full-text article views including HTML views, PDF and ePub downloads, according to the available data) and Abstracts Views on Vision4Press platform.
Data correspond to usage on the plateform after 2015. The current usage metrics is available 48-96 hours after online publication and is updated daily on week days.
Initial download of the metrics may take a while.