Fig. E.1
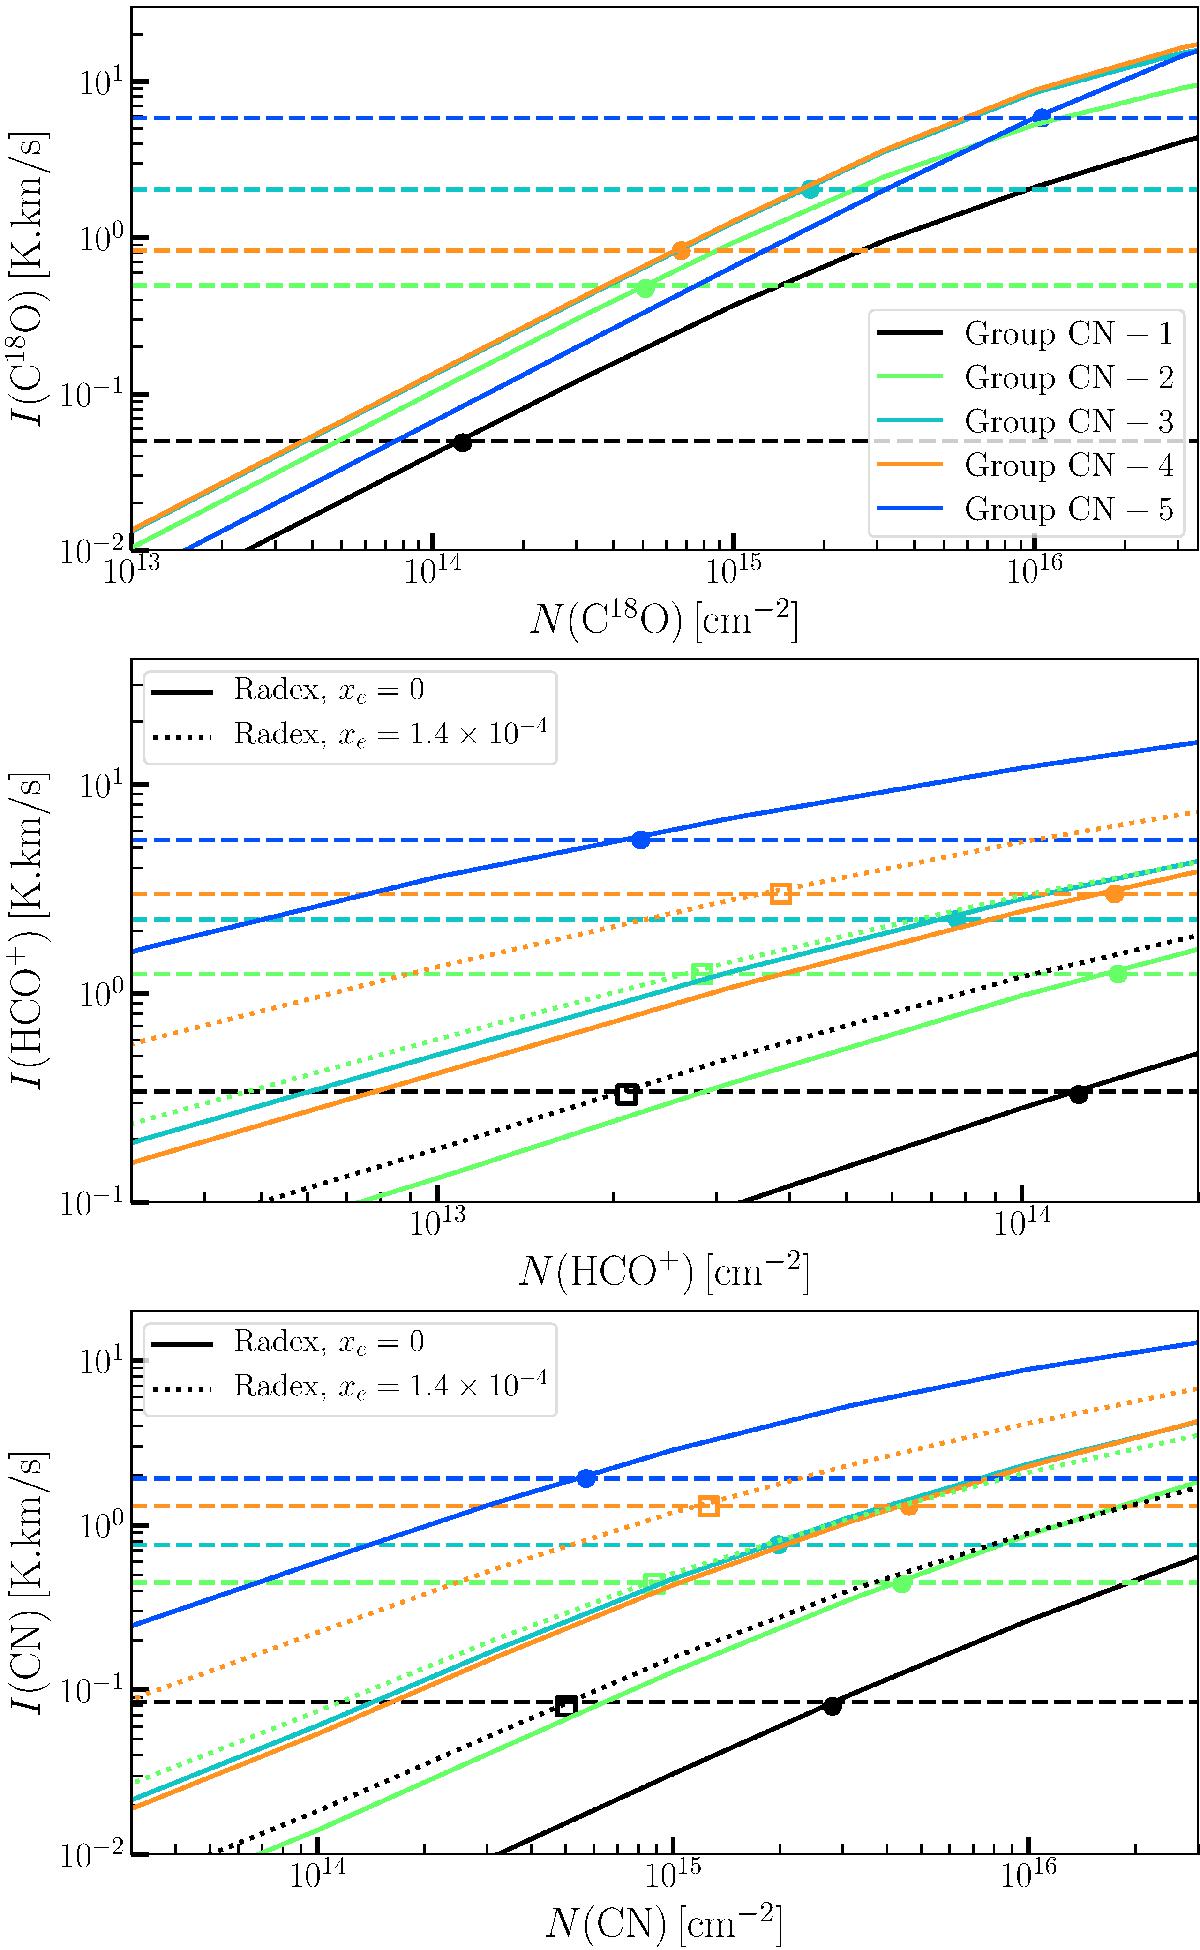
Line intensity as a function of column density for non-LTE radiative transfer models at the median gas volume density and temperature for each CN group. The full and dotted lines assume a ionisation fraction of 0 and 1.4 × 10⁻⁴, respectively. The horizontal dashed lines represent the median observed intensity computed for each group. The symbols show the best column density for each group according to the RADEX models, with full circles for models with xe = 0 and open squares for xe = 1.4 × 10⁻⁴.
Current usage metrics show cumulative count of Article Views (full-text article views including HTML views, PDF and ePub downloads, according to the available data) and Abstracts Views on Vision4Press platform.
Data correspond to usage on the plateform after 2015. The current usage metrics is available 48-96 hours after online publication and is updated daily on week days.
Initial download of the metrics may take a while.