Fig. A.2
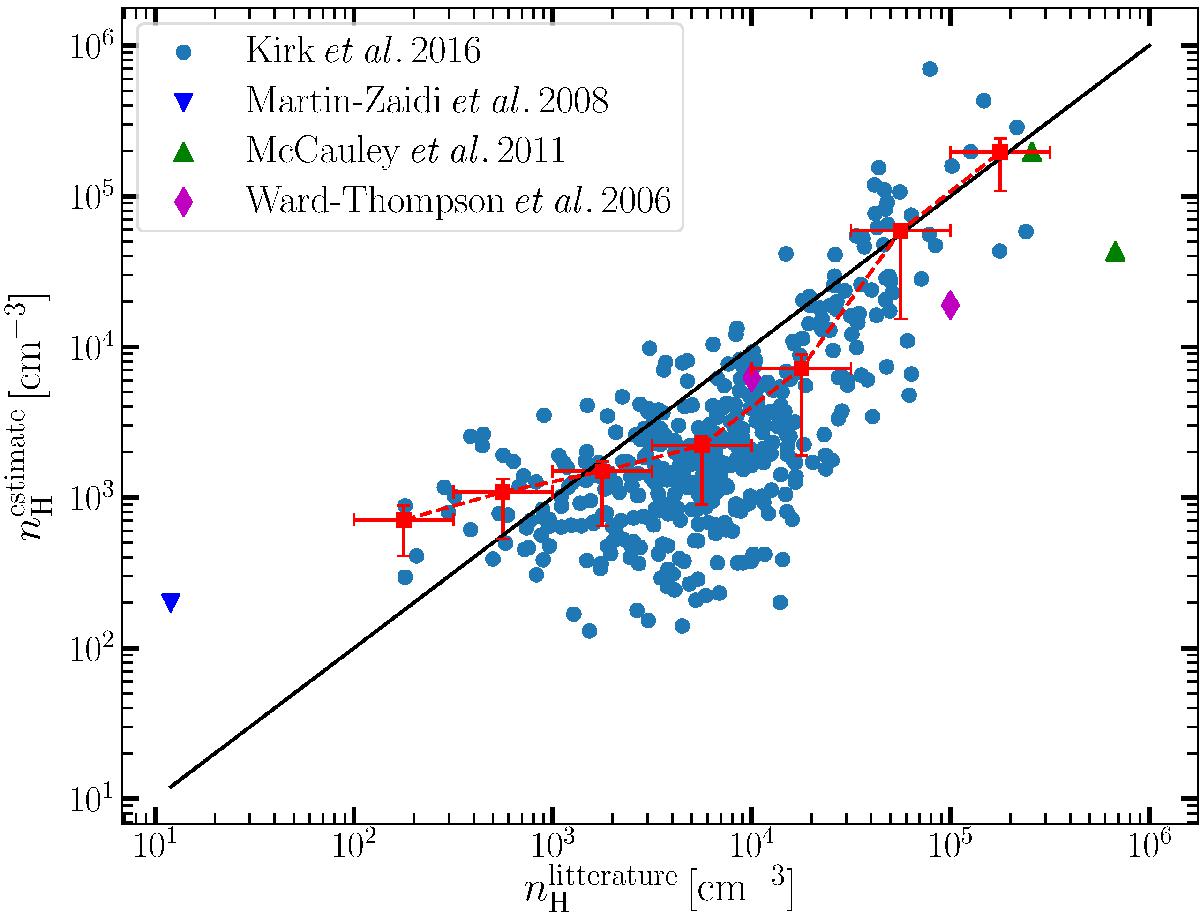
Approximate estimation of the volume density as a function of independent estimations from the literature. The solid black line shows a perfect one-to-one relationship, while the red points and their error bars show the bin averaged relationship. The horizontal and vertical error bars indicates the bin size and the interquartile interval, respectively.
Current usage metrics show cumulative count of Article Views (full-text article views including HTML views, PDF and ePub downloads, according to the available data) and Abstracts Views on Vision4Press platform.
Data correspond to usage on the plateform after 2015. The current usage metrics is available 48-96 hours after online publication and is updated daily on week days.
Initial download of the metrics may take a while.