Fig. A.1
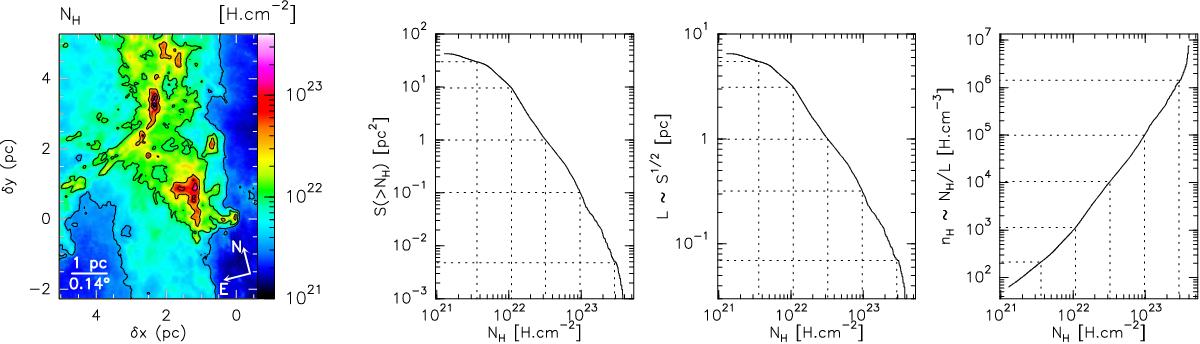
Steps to statistically derive an approximate volume density from the column density under the assumptions of isotropy and of nested distributions of increasing density. Panel a: spatial distribution of the column density of gas as deduced from the spectral energy distribution of the dust continuum emission. Panel b: surface area of the observed field of view that has a column density larger than a lower limit. Panel c: typical depth (square root of the previous surface) associated with a given column density. Panel d: typical volume density associated with a given column density. The contour levels in panel a and the dashed vertical lines in panels b to d take the column density values corresponding to a visual extinction of 2, 6, 18, 54, and 162 mag.
Current usage metrics show cumulative count of Article Views (full-text article views including HTML views, PDF and ePub downloads, according to the available data) and Abstracts Views on Vision4Press platform.
Data correspond to usage on the plateform after 2015. The current usage metrics is available 48-96 hours after online publication and is updated daily on week days.
Initial download of the metrics may take a while.