Fig. 15
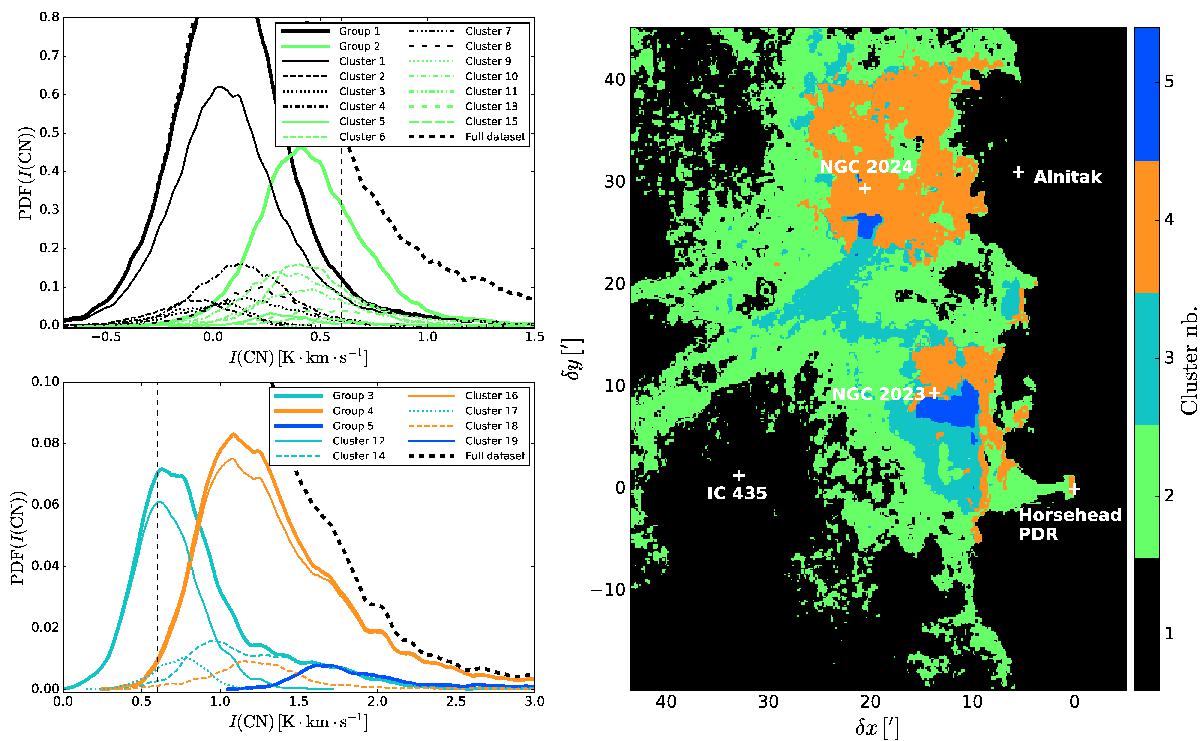
Left: 1D PDF of CN (1–0) line intensity, comparing the full dataset PDF (thick dashed black line), the contribution of each of the groups defined in Sect. 5.3 (coloured thick lines), and the contribution of each individual cluster (thin coloured lines). The contributions of clusters are coloured according to the group to which they belong. For readability, we have separated groups CN-1 and CN-2 and their constitutive clusters (top panel) and groups CN-3 to CN-5 and their constitutive clusters (bottom panel). Right: map of the 5 groups resulting from the grouping of consecutive clusters described in the text (Sect. 5.3).
Current usage metrics show cumulative count of Article Views (full-text article views including HTML views, PDF and ePub downloads, according to the available data) and Abstracts Views on Vision4Press platform.
Data correspond to usage on the plateform after 2015. The current usage metrics is available 48-96 hours after online publication and is updated daily on week days.
Initial download of the metrics may take a while.