Fig. 12
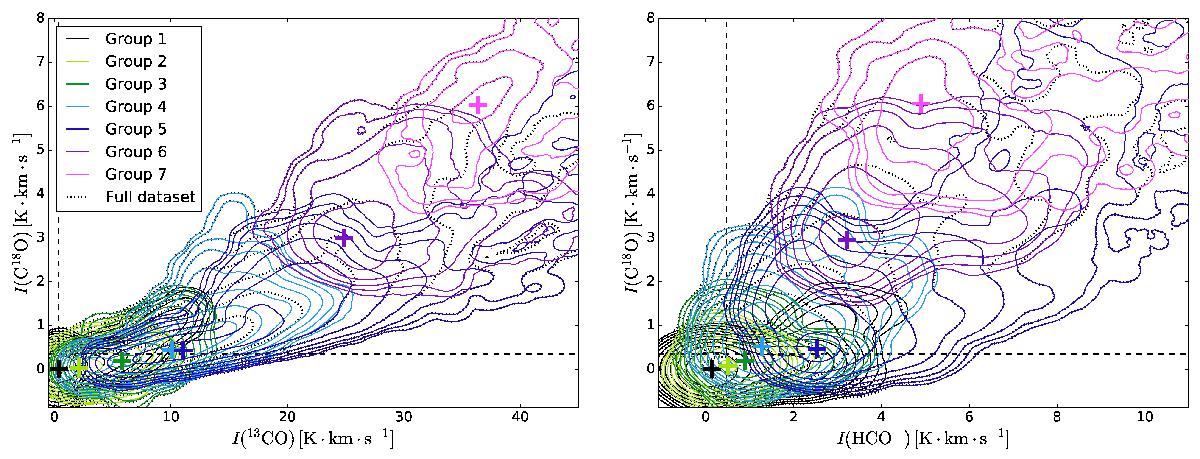
Contour plot of the 2D PDFs of C18O vs. 13CO (left) and C18O vs. HCO+ (right). The PDFs of the total dataset are shown as black dotted contours. The contributions of the 7 groups resulting from the grouping discussed in the text are shown in contours coloured according to Fig. 11 (right). In addition, the PDF maximum of each group is shown as a cross with the same colour as the group.
Current usage metrics show cumulative count of Article Views (full-text article views including HTML views, PDF and ePub downloads, according to the available data) and Abstracts Views on Vision4Press platform.
Data correspond to usage on the plateform after 2015. The current usage metrics is available 48-96 hours after online publication and is updated daily on week days.
Initial download of the metrics may take a while.