Fig. 9
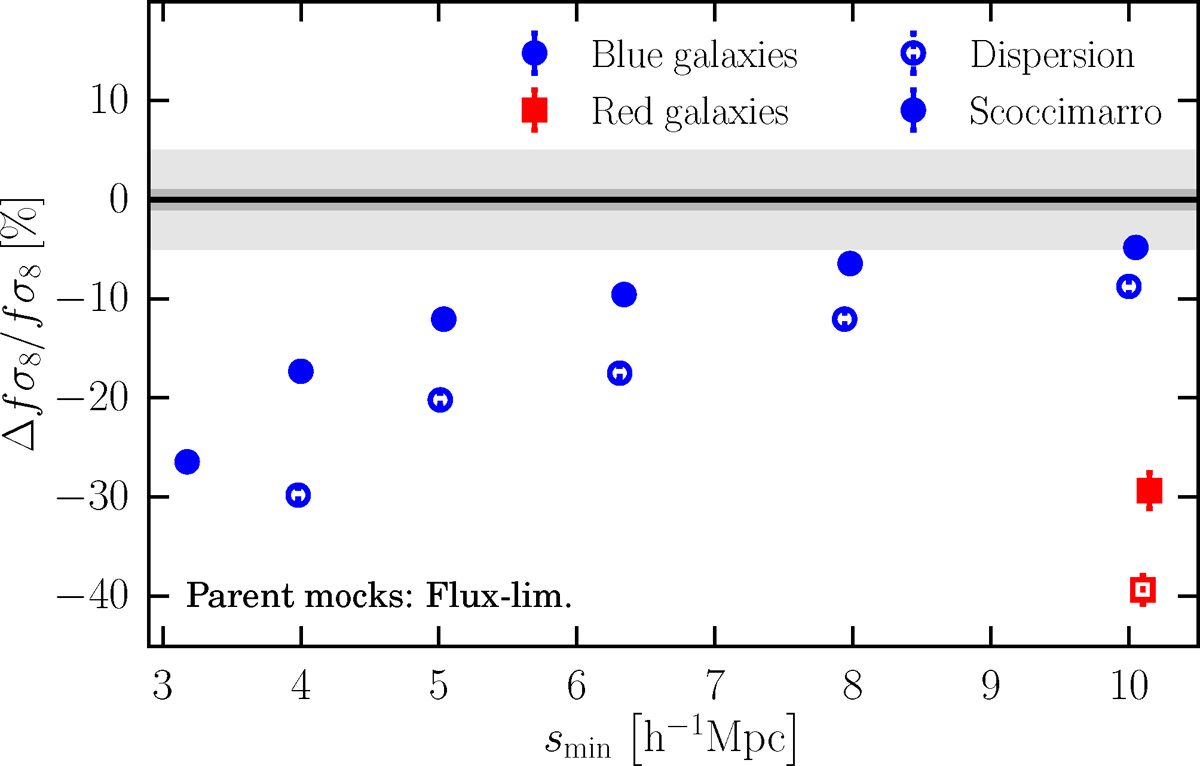
Systematic errors on the estimates of the growth rate fσ8 when using the full parent mock flux-limited samples of blue and red galaxies in the redshift range 0.6 ≤ z ≤ 1.0. The statistical errors, corresponding to the mean among 153 realizations, are also shown as vertical error bars although for the blue galaxies these are smaller than the size of points. The shaded regions correspond to 1% and 5% intervals on the growth rate, after marginalization over the hidden parameters of bias and velocity dispersion. We recall here that the apparent lack of red squares for smin < 10 h−1 Mpc is due to the large systematic errors from the red galaxies which are always greater than 45%. Here, as in the following plots, points at the same smin are slightly displaced for clarity.
Current usage metrics show cumulative count of Article Views (full-text article views including HTML views, PDF and ePub downloads, according to the available data) and Abstracts Views on Vision4Press platform.
Data correspond to usage on the plateform after 2015. The current usage metrics is available 48-96 hours after online publication and is updated daily on week days.
Initial download of the metrics may take a while.