Fig. 7
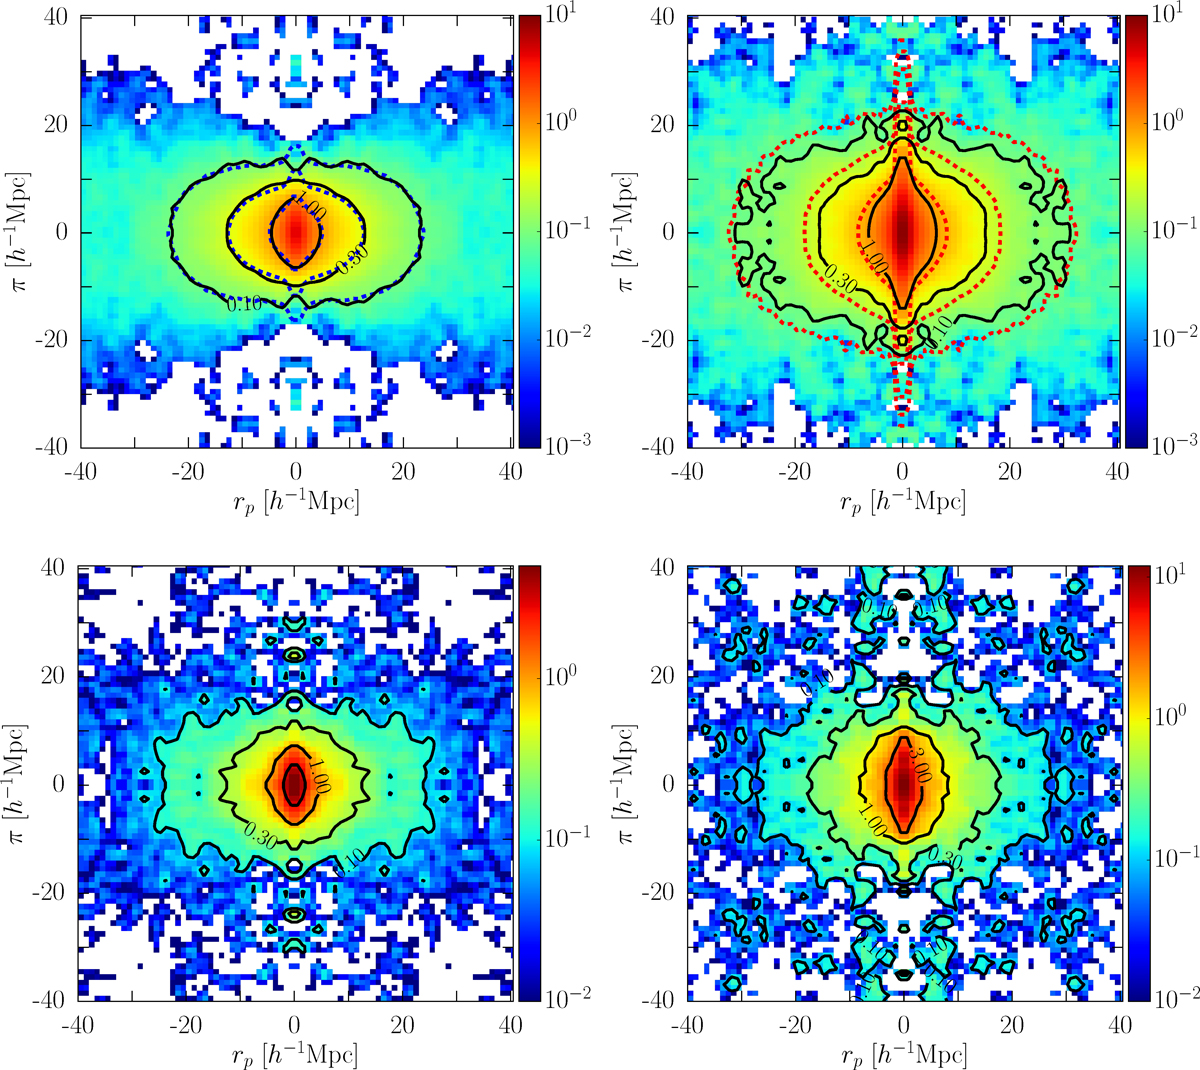
Redshift-space two-point correlation function ξs(rp, π), measured at 0.6 ≤ z ≤ 1.0 from flux-limited (top row) and volume-limited samples (bottom row) of blue (left) and red (right) VIPERS galaxies (colour scale and solid contours). The measurements are binned in 1 h−1 Mpc bins in both directions and have been smoothed with a Gaussian filter with dispersion σ = 0.8 h−1 Mpc. The more prominent small-scale stretching along the line of sight is clear in the clustering of red galaxies (right panels), which is almost absent for the blue galaxies (left panels). The dotted lines overplotted on the two top panels report instead for comparison the corresponding (un-smoothed) estimates from the mean of the 153 blue and red mock samples. The agreement of the blue mocks with the data is excellent. Conversely, the red mocks show, in addition to their known slightly larger linear bias value, a significantly stronger small-scale stretching, indicating a higher non-linear velocity component with respect to the data (see text for discussion). In the two bottompanels the look-up table has been normalised as to get the same top colour at the peak value of ξs (rp, π), while settingthe bottom limit to ξs(rp, π) = 0.01.
Current usage metrics show cumulative count of Article Views (full-text article views including HTML views, PDF and ePub downloads, according to the available data) and Abstracts Views on Vision4Press platform.
Data correspond to usage on the plateform after 2015. The current usage metrics is available 48-96 hours after online publication and is updated daily on week days.
Initial download of the metrics may take a while.