Fig. 5
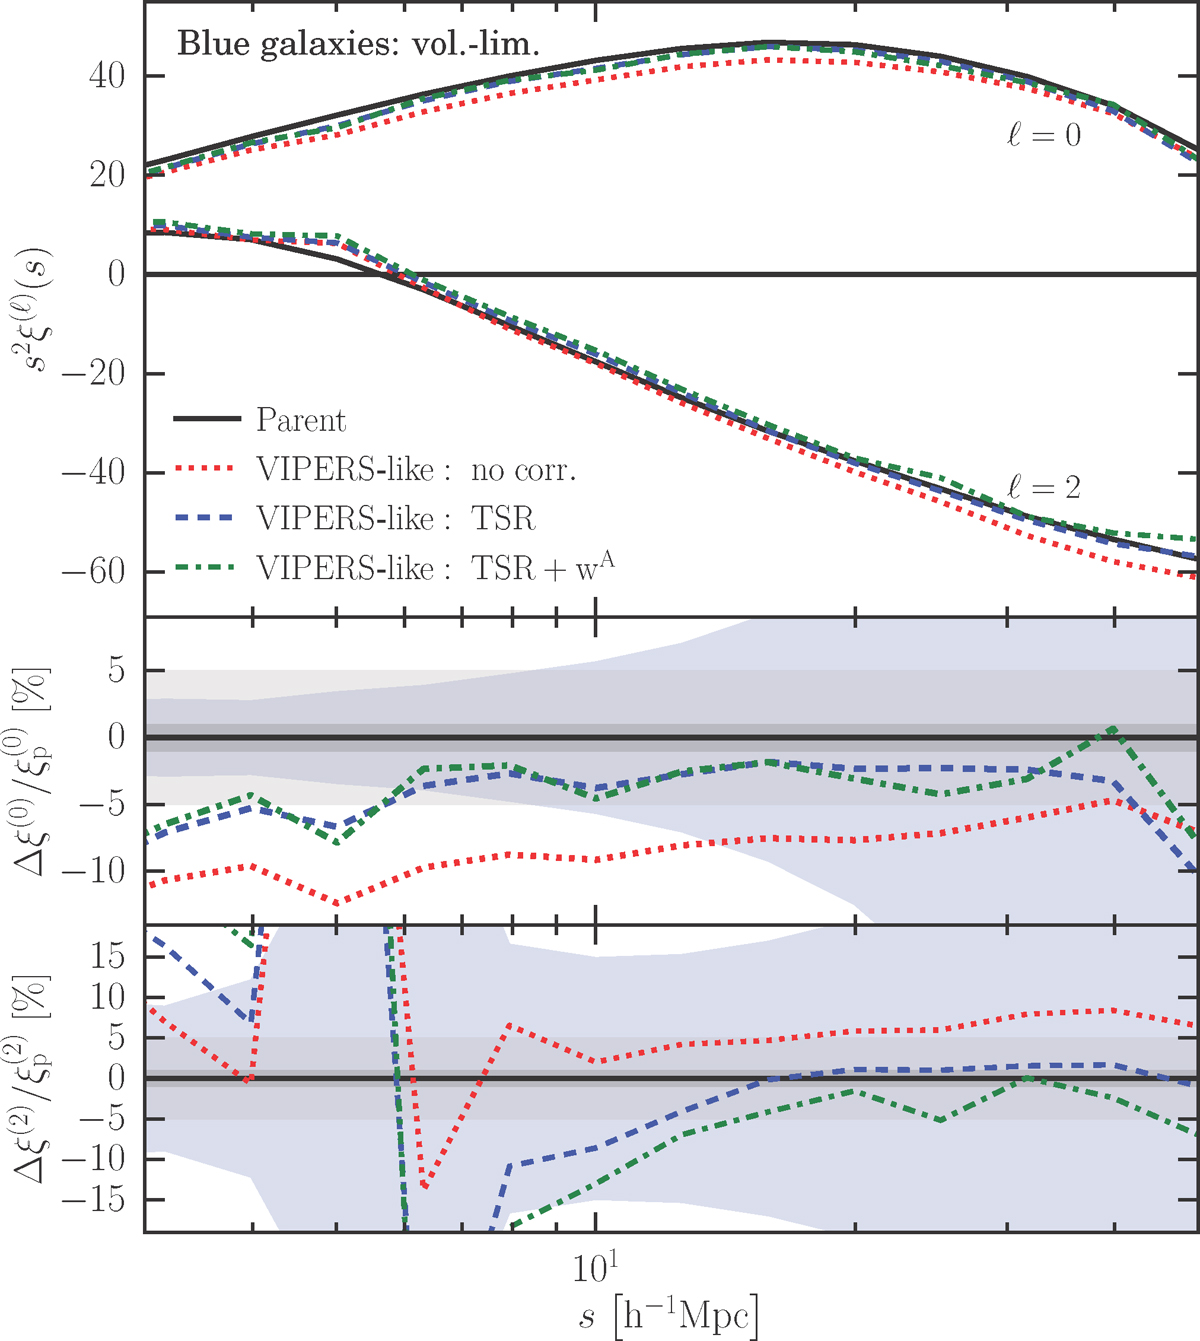
Impact of different corrections on the measured multipole moments of the two-point correlation function of blue galaxies in volume-limited mock samples. Top panel shows the measurements, while middle and bottom panels contain the relative systematic error on the monopole and quadrupole, respectively. Black continuous lines result from parent mocks. Red dotted lines are the raw estimates from VIPERS-like mocks. Blue dashed lines result from correcting the multipoles for TSR only (also, no SSR correction is needed for the mocks). Green dash-dotted lines are the case when both TSR (wTSR) and angular (wA) weights are applied. Horizontal grey shaded bands in the middle and bottom panels delimit the 1% and 5% regions, while blue shaded regions show the 1σ error on the mean estimates of the multipole in parent mocks.
Current usage metrics show cumulative count of Article Views (full-text article views including HTML views, PDF and ePub downloads, according to the available data) and Abstracts Views on Vision4Press platform.
Data correspond to usage on the plateform after 2015. The current usage metrics is available 48-96 hours after online publication and is updated daily on week days.
Initial download of the metrics may take a while.