Fig. 3

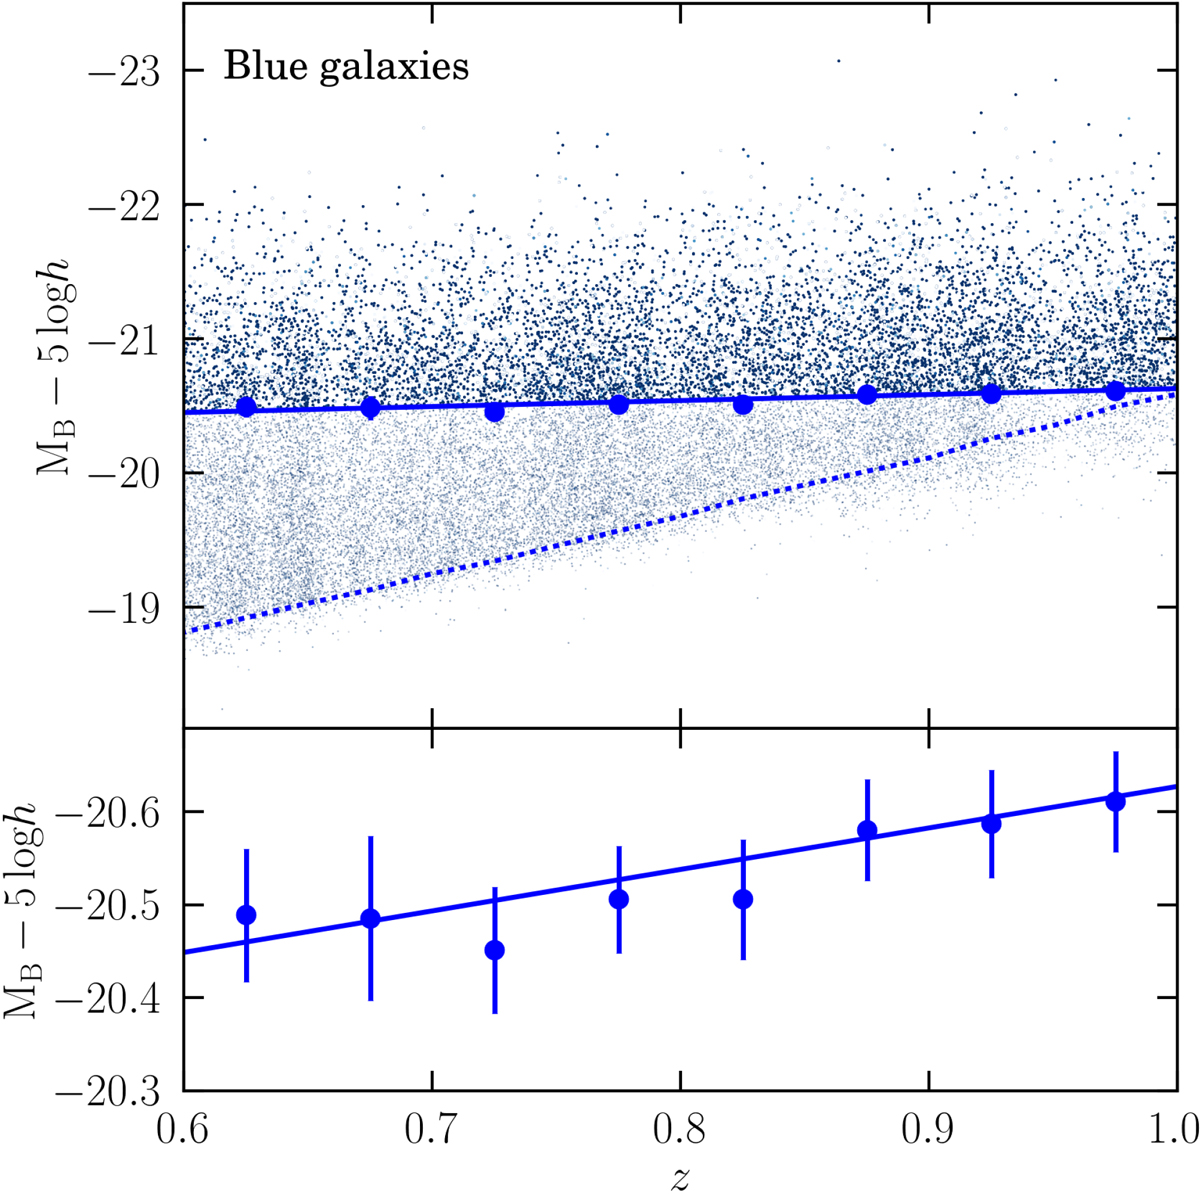
Magnitude-redshift diagram of VIPERS blue galaxies. Top panel: scatter plot in the magnitude (MB)-redshift plane. Dark dots represent galaxies included in the volume-limited sample while the light dots show the ones excluded due to the luminosity threshold. Points show the luminosity threshold ![]() estimated by imposing a constant comoving number density as a function of redshift. The continuous lines are the best-fit model (Eq. (4)) to the points while the dashed curve represents the 90% completeness level of the survey. Bottom panel: a zoom-in to highlight the agreement between data and model for the luminosity evolution.
estimated by imposing a constant comoving number density as a function of redshift. The continuous lines are the best-fit model (Eq. (4)) to the points while the dashed curve represents the 90% completeness level of the survey. Bottom panel: a zoom-in to highlight the agreement between data and model for the luminosity evolution.
Current usage metrics show cumulative count of Article Views (full-text article views including HTML views, PDF and ePub downloads, according to the available data) and Abstracts Views on Vision4Press platform.
Data correspond to usage on the plateform after 2015. The current usage metrics is available 48-96 hours after online publication and is updated daily on week days.
Initial download of the metrics may take a while.


