Fig. 2
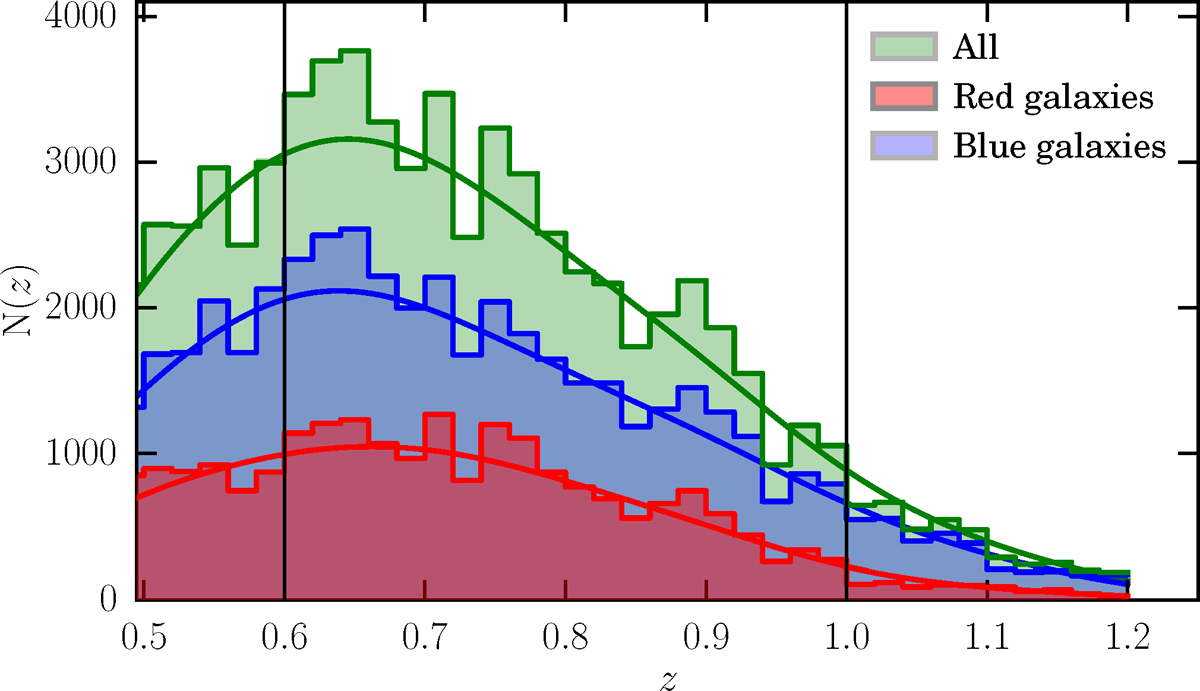
Un-normalised redshift distributions of VIPERS galaxies in the redshift range 0.5 ≤ z ≤ 1.2. The red and blue filled histograms show the observed number of blue and red galaxies respectively, i.e. when each galaxy is weighted by its blue wb or red wr colour weight only (see Eq. (3)), resulting from our classification scheme (Sect. 2). Thedistribution of all galaxies is also shown with green filled histogram. The continuous lines superposedon the histograms show the same distributions after convolving with a Gaussian kernel with σz = 0.07. Vertical black lines delimit the redshift range used in this analysis.
Current usage metrics show cumulative count of Article Views (full-text article views including HTML views, PDF and ePub downloads, according to the available data) and Abstracts Views on Vision4Press platform.
Data correspond to usage on the plateform after 2015. The current usage metrics is available 48-96 hours after online publication and is updated daily on week days.
Initial download of the metrics may take a while.