Fig. C.1
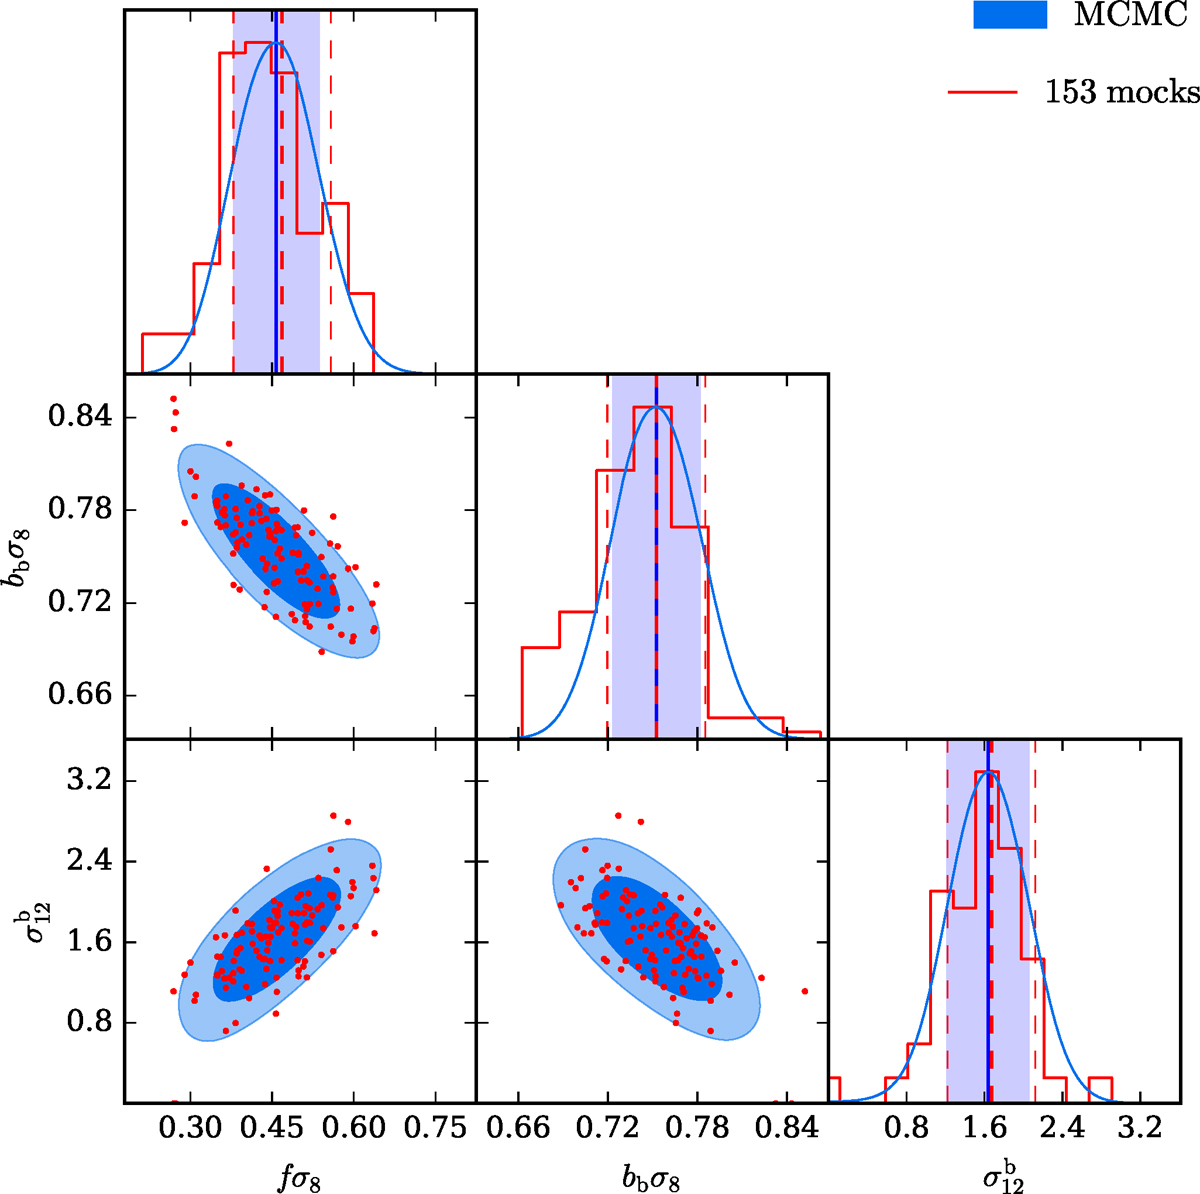
Results of fitting the auto-correlation of blue galaxies in the volume-limited VIPERS-like mocks between 5 h−1 Mpc < s < 50 h−1 Mpc with the Scoccimarro model. In all panels, blue colour shows results using the MCMC technique while red colour represents results obtained fitting single mocks. The blue smooth curves and coloured contours show respectively the one- and two-dimensional marginalised posterior likelihood distributions obtained running an MCMC algorithm. The red points and the histograms correspond to the best-fit values obtained from each of the 153 VIPERS mocks. For each single-parameter distribution, the vertical thick solid blue and red dashed lines show the best-fit values, while the vertical shaded blue stripes and thin dashed red lines give the corresponding 1σ statistical errors, respectively.
Current usage metrics show cumulative count of Article Views (full-text article views including HTML views, PDF and ePub downloads, according to the available data) and Abstracts Views on Vision4Press platform.
Data correspond to usage on the plateform after 2015. The current usage metrics is available 48-96 hours after online publication and is updated daily on week days.
Initial download of the metrics may take a while.