Fig. 1
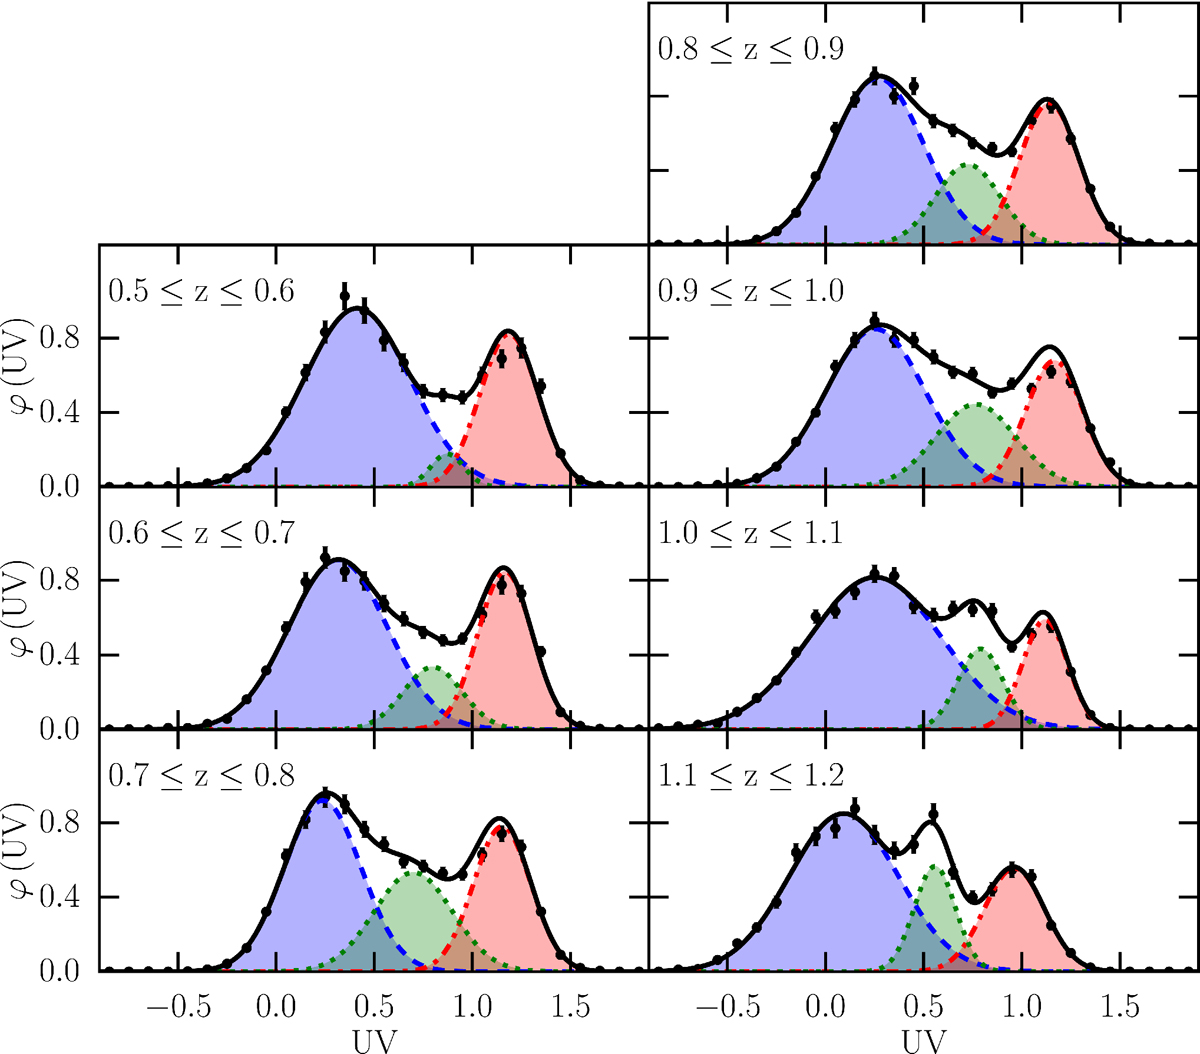
Normalised distribution of galaxy rest-frame UV colour in VIPERS in the redshift range 0.5 ≤ z ≤ 1.2 (points). Statistical uncertainties include contributions from Poissonian shot noise and cosmic variance, estimated using the linear bias relation with b = 1.4 (see Appendix D). The best-fit models (Eq. (1)) are shown as black continuous lines. Contributions to the model from the galaxies belonging to the blue cloud, red sequence and green valley are plotted as blue dashed, red dash-dotted and green dotted lines, respectively.
Current usage metrics show cumulative count of Article Views (full-text article views including HTML views, PDF and ePub downloads, according to the available data) and Abstracts Views on Vision4Press platform.
Data correspond to usage on the plateform after 2015. The current usage metrics is available 48-96 hours after online publication and is updated daily on week days.
Initial download of the metrics may take a while.