Fig. A.1
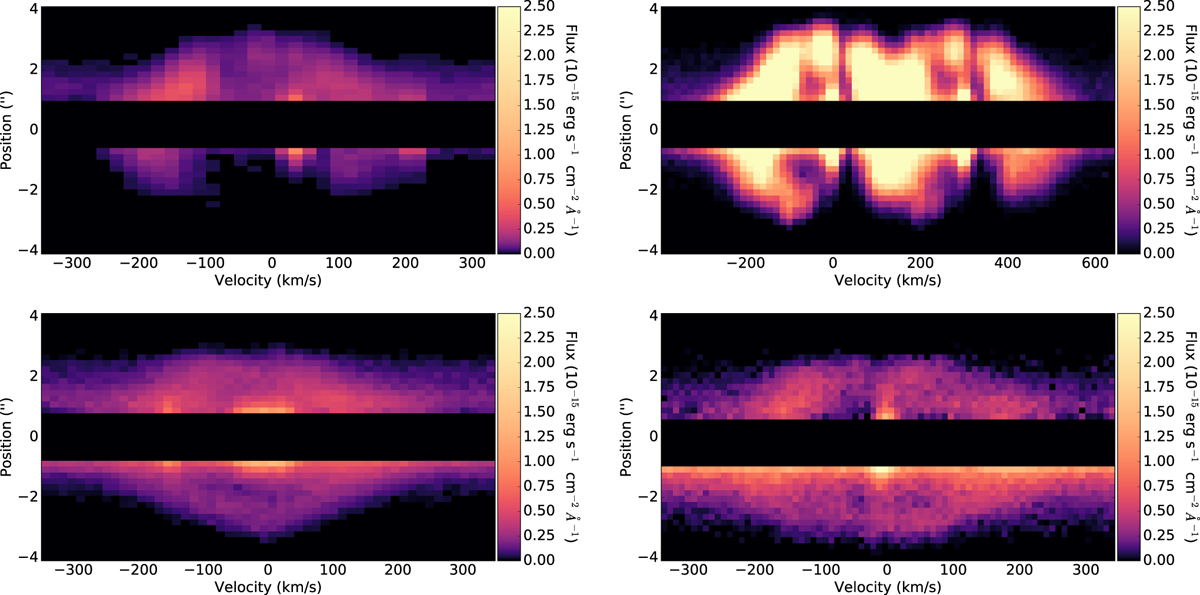
Position-velocity diagrams of CH+ (top left), Na I D (top right), Hα (bottom left) and the [C I] line at 9850 Å (bottom right) in V854 Cen. Both CH+ and Na I D show a shape very similar to Ca II K (see main text); however, both Na I D components have a strong zero-velocity component. Note that the narrow emission line in the CH+ diagram at ~50 km s−1 is likely due to Na II. Hα and [C I] shows a similar, although less pronounced, behaviour.
Current usage metrics show cumulative count of Article Views (full-text article views including HTML views, PDF and ePub downloads, according to the available data) and Abstracts Views on Vision4Press platform.
Data correspond to usage on the plateform after 2015. The current usage metrics is available 48-96 hours after online publication and is updated daily on week days.
Initial download of the metrics may take a while.