Fig. 1
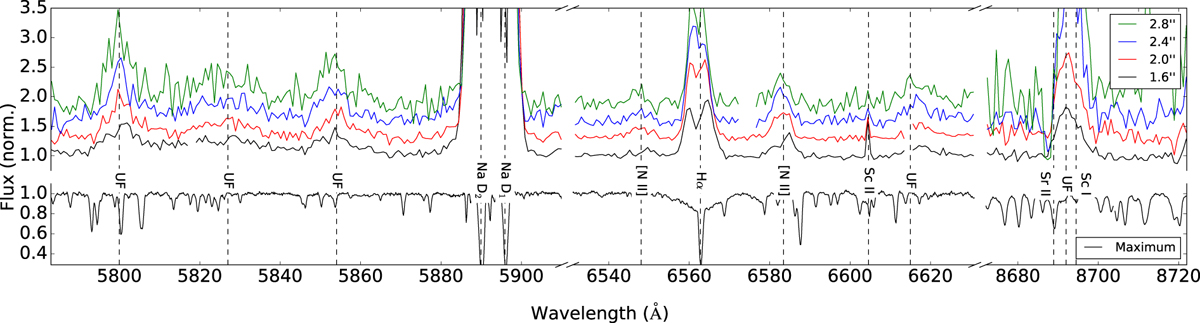
V854 Cen decline spectra at different offsets from the central object (see inset) and at maximum light (bottom spectrum). During a decline, the absorption spectrum converts into an emission spectrum, the strongest emission lines being the Na I D doublet. The progressive eclipsing of narrow emission lines during the decline, but not the broad lines, implies that the broad line emission is more extended (Clayton 1996). Additionally, a sequence of unidentified emission features is clearly detected between 5800 and 5860 Å, at 6617 Å, and at 8692 Å. The narrow Y II λ6614 emission line has been removed from the 1.6″ and 2.0″ offset spectra for plotting purposes. The absorption lines near 5800 and 5854 Å are due to C I and Ba II, respectively.
Current usage metrics show cumulative count of Article Views (full-text article views including HTML views, PDF and ePub downloads, according to the available data) and Abstracts Views on Vision4Press platform.
Data correspond to usage on the plateform after 2015. The current usage metrics is available 48-96 hours after online publication and is updated daily on week days.
Initial download of the metrics may take a while.