Fig. 9
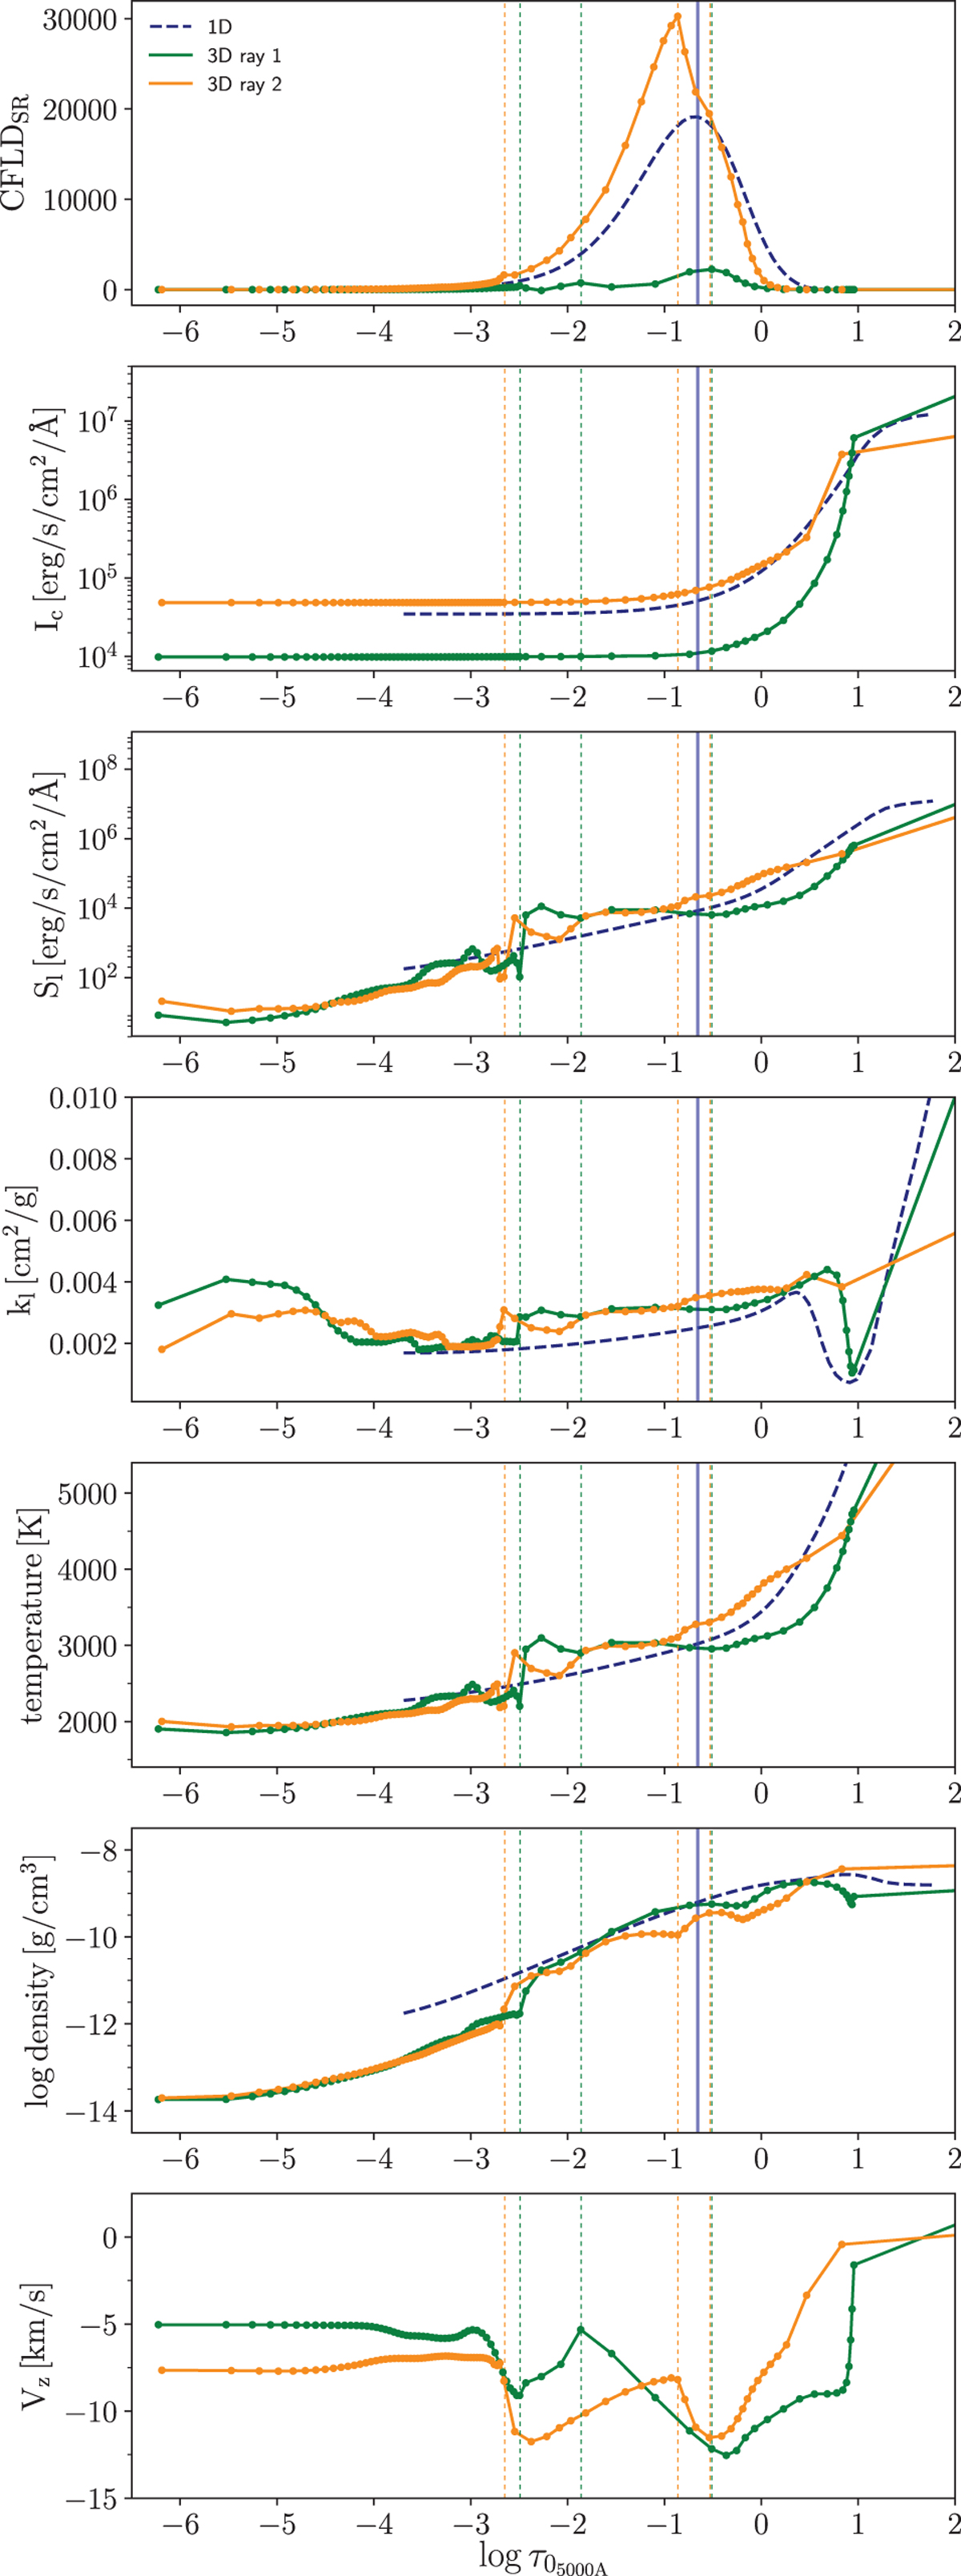
CFLDSR, continuum intensity Ic, line source function Sl, line absorption coefficient kl , temperature, logarithmic density and Vz structures at λ = 4040.07 for two single rays of the 3D snapshot located in bright and dark areas on the stellar disk (orange and green colors indicate rays 2 and 1, respectively, in Fig. 6) and for the corresponding 1D-RSG model of Table 1 (blue dashed line). Vertical lines correspond to local maxima of CFLDs.
Current usage metrics show cumulative count of Article Views (full-text article views including HTML views, PDF and ePub downloads, according to the available data) and Abstracts Views on Vision4Press platform.
Data correspond to usage on the plateform after 2015. The current usage metrics is available 48-96 hours after online publication and is updated daily on week days.
Initial download of the metrics may take a while.