Free Access
Fig. 7
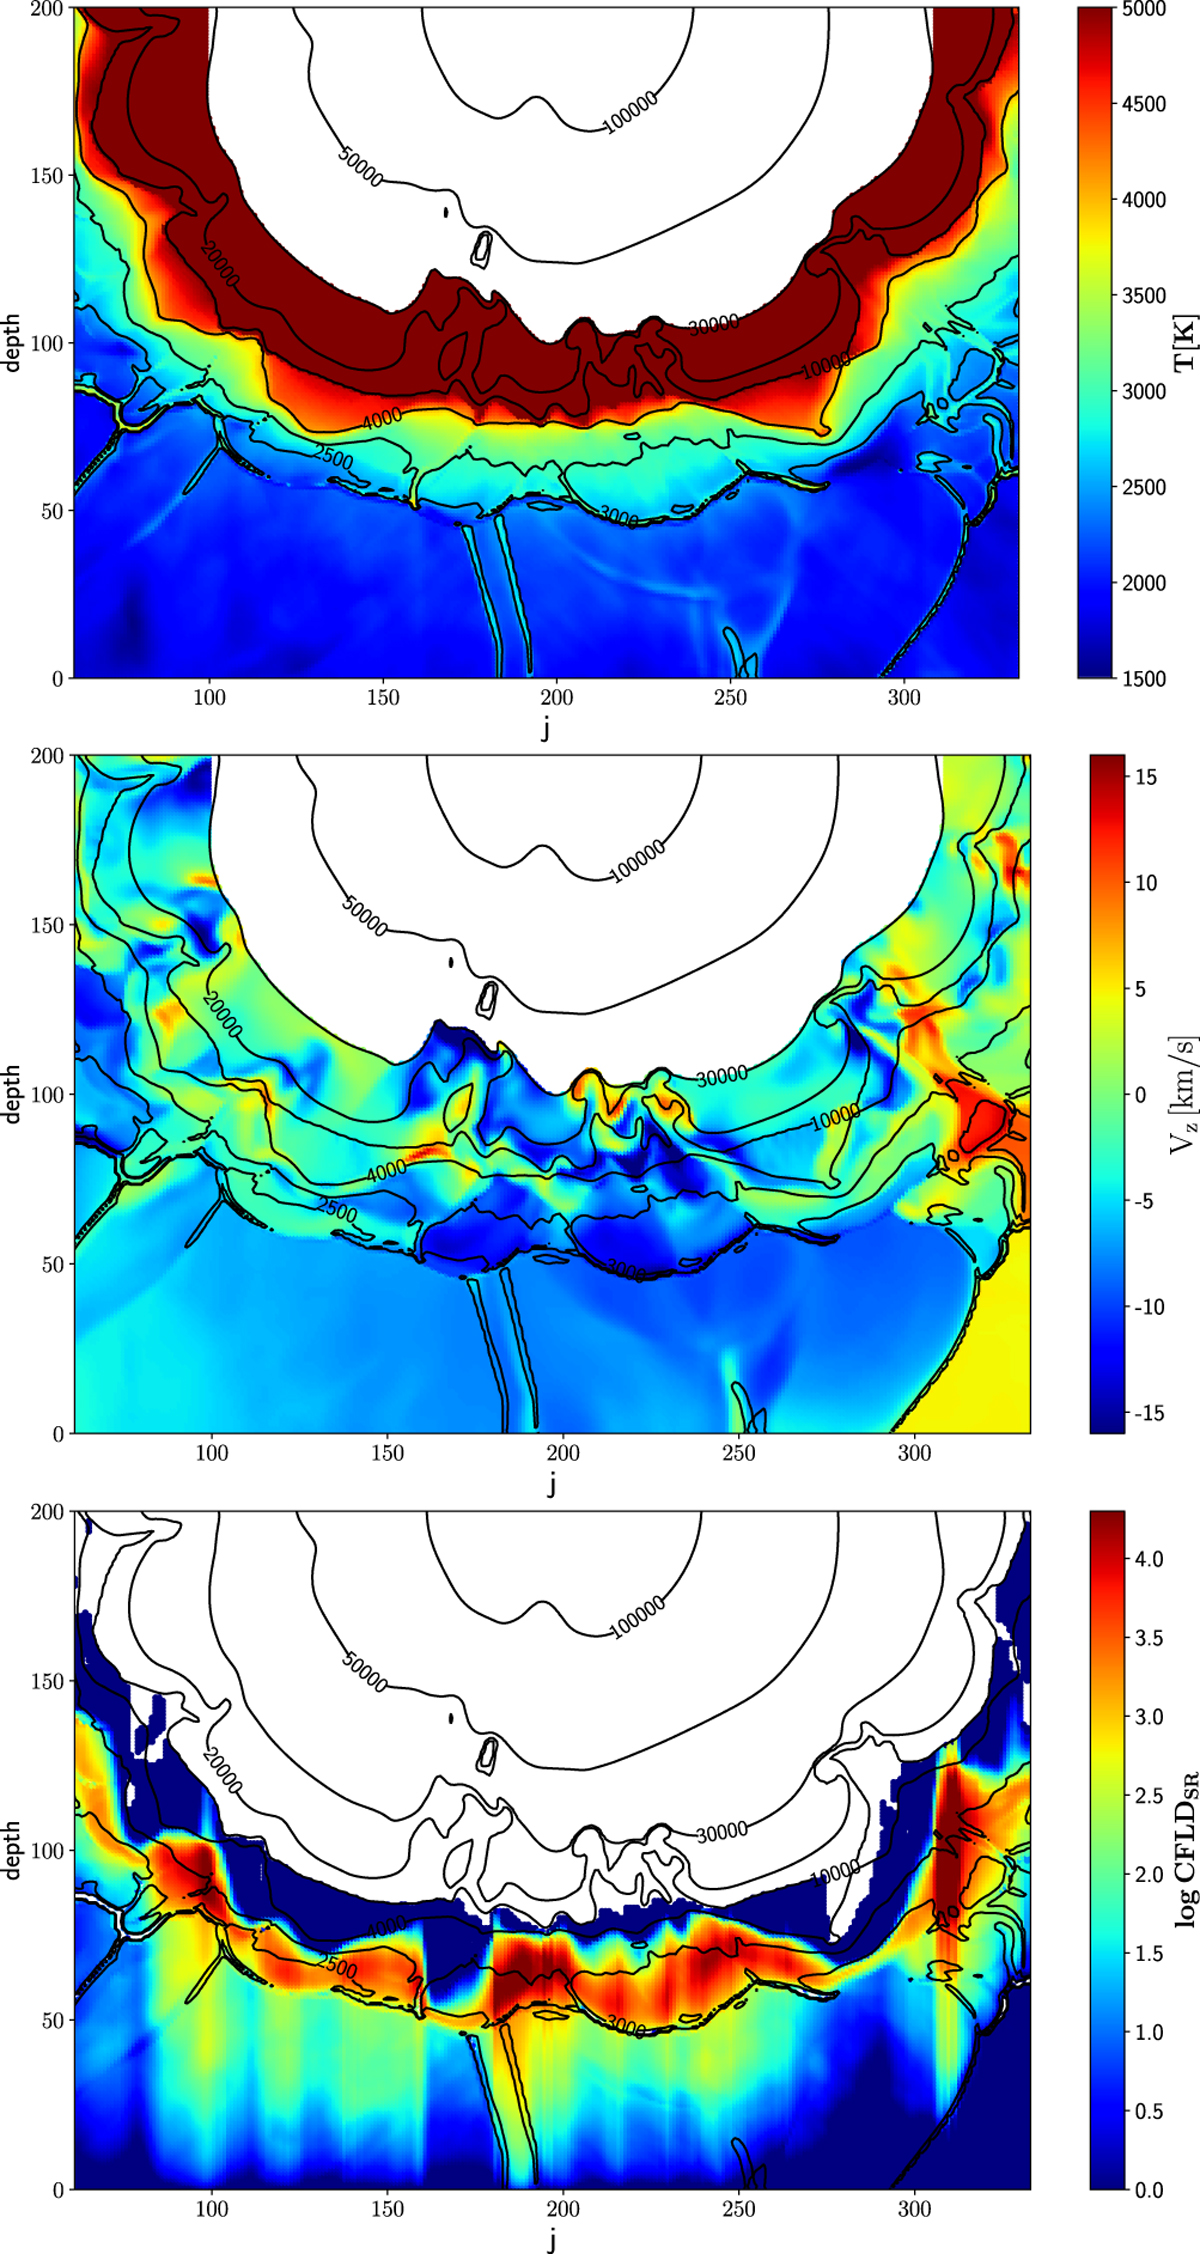
Temperature T, projected velocity Vz and log CFLDSR structures for the slice through the 3D numerical box. The observer is at the bottom of each figure. Black contour lines on all panels show the thermal stratification.
Current usage metrics show cumulative count of Article Views (full-text article views including HTML views, PDF and ePub downloads, according to the available data) and Abstracts Views on Vision4Press platform.
Data correspond to usage on the plateform after 2015. The current usage metrics is available 48-96 hours after online publication and is updated daily on week days.
Initial download of the metrics may take a while.