Free Access
Fig. 4
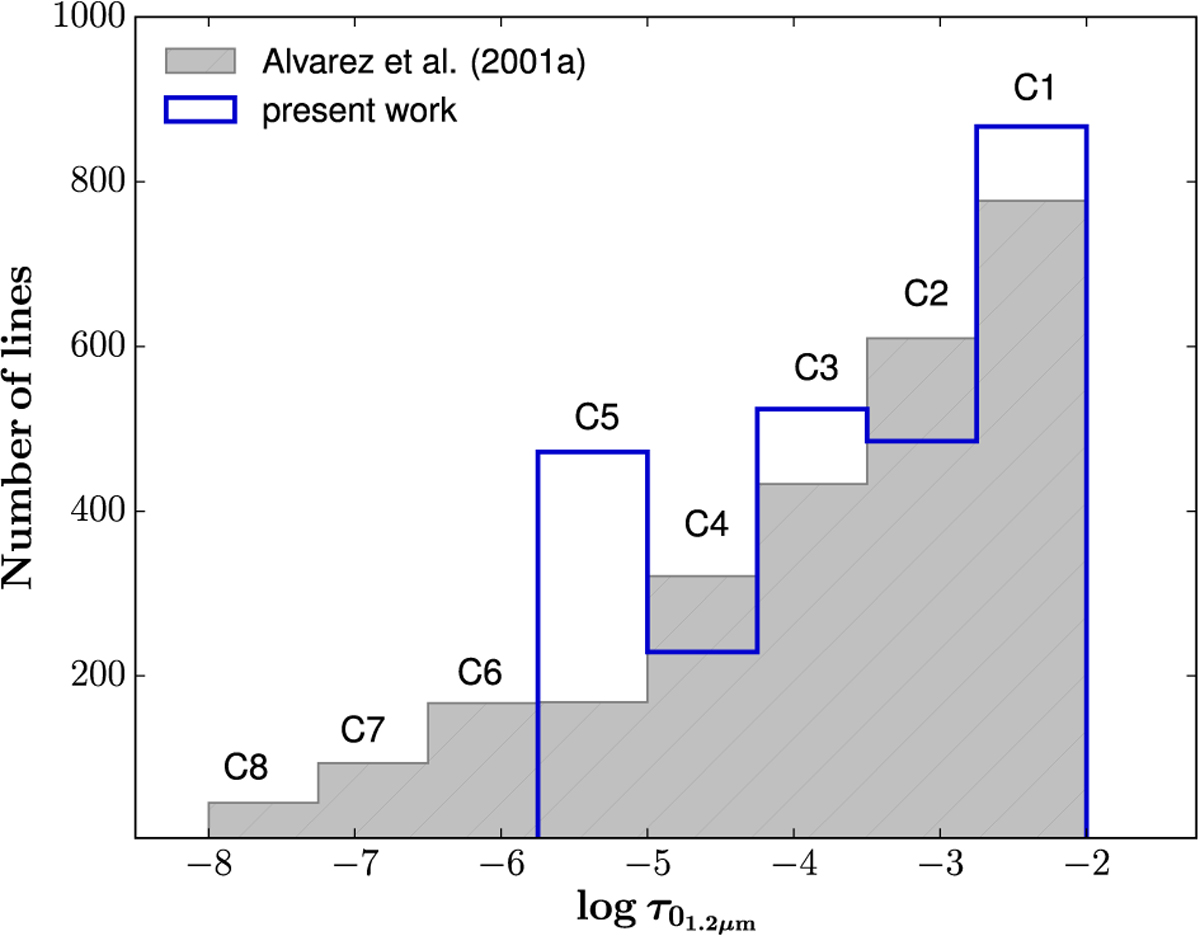
Distribution of lines in spectral masks C1–C8 obtained by Alvarez et al. (2001a; gray shaded histogram) and in the present work (blue line) for the 1D-AGB model (Table 1).
Current usage metrics show cumulative count of Article Views (full-text article views including HTML views, PDF and ePub downloads, according to the available data) and Abstracts Views on Vision4Press platform.
Data correspond to usage on the plateform after 2015. The current usage metrics is available 48-96 hours after online publication and is updated daily on week days.
Initial download of the metrics may take a while.