Fig. 17
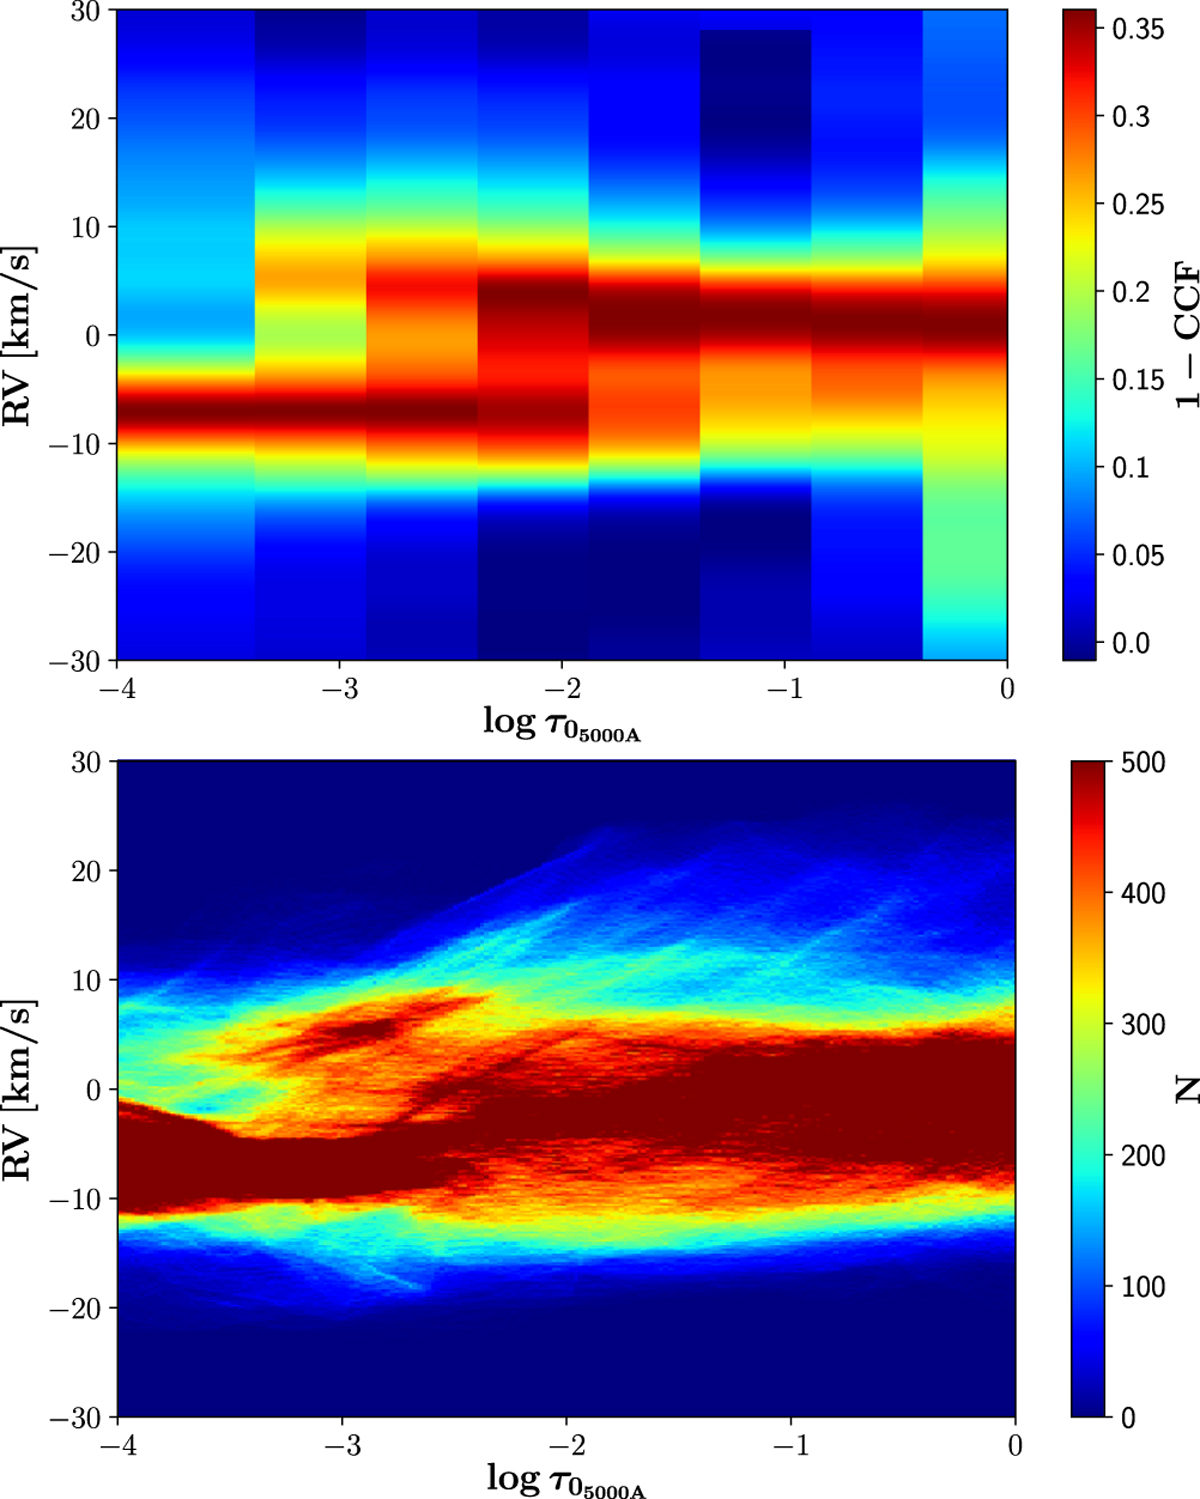
Top panel: CCFs computed on a snapshot spectrum from the 3D simulation as a function of the reference optical depth scale and the velocity. The color code shows the minimum (red color) and maximum (blue color) values of each CCF. Bottom panel: distribution of Vz velocities of the 3D simulation as a function of the reference optical depth. The color code shows areas with high (red) or low (blue) density of points.
Current usage metrics show cumulative count of Article Views (full-text article views including HTML views, PDF and ePub downloads, according to the available data) and Abstracts Views on Vision4Press platform.
Data correspond to usage on the plateform after 2015. The current usage metrics is available 48-96 hours after online publication and is updated daily on week days.
Initial download of the metrics may take a while.