Fig. 16
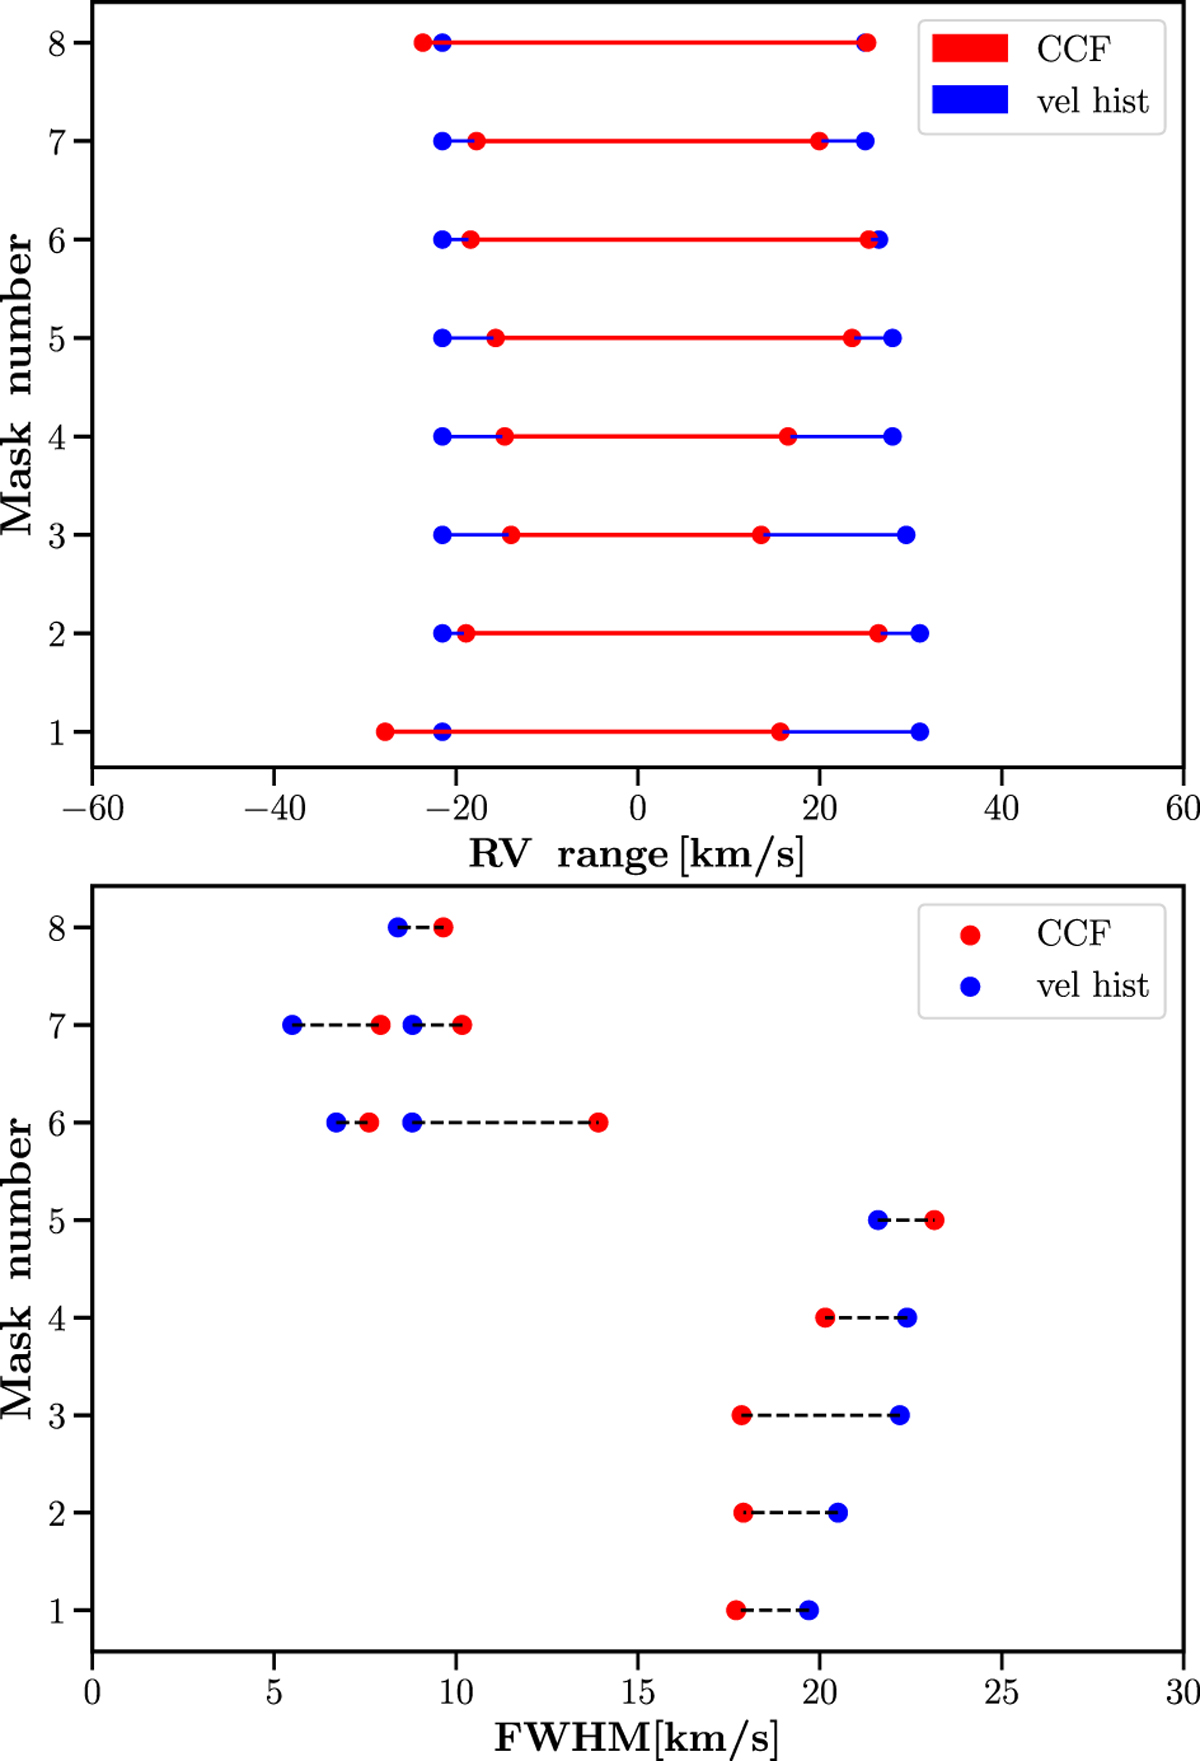
Top panel: velocity range covered by CCFs (red color) and velocity histograms (blue color) from Fig. 15 in each spectral mask. Bottom panel: FWHM of CCF profiles (red color) and velocity distributions (blue color) for all masks. In masks C6 and C7 the FWHM were measured separately for each of the two peaks. The dashed black line connects the FWHM values of corresponding peaks.
Current usage metrics show cumulative count of Article Views (full-text article views including HTML views, PDF and ePub downloads, according to the available data) and Abstracts Views on Vision4Press platform.
Data correspond to usage on the plateform after 2015. The current usage metrics is available 48-96 hours after online publication and is updated daily on week days.
Initial download of the metrics may take a while.