Free Access
Fig. 15
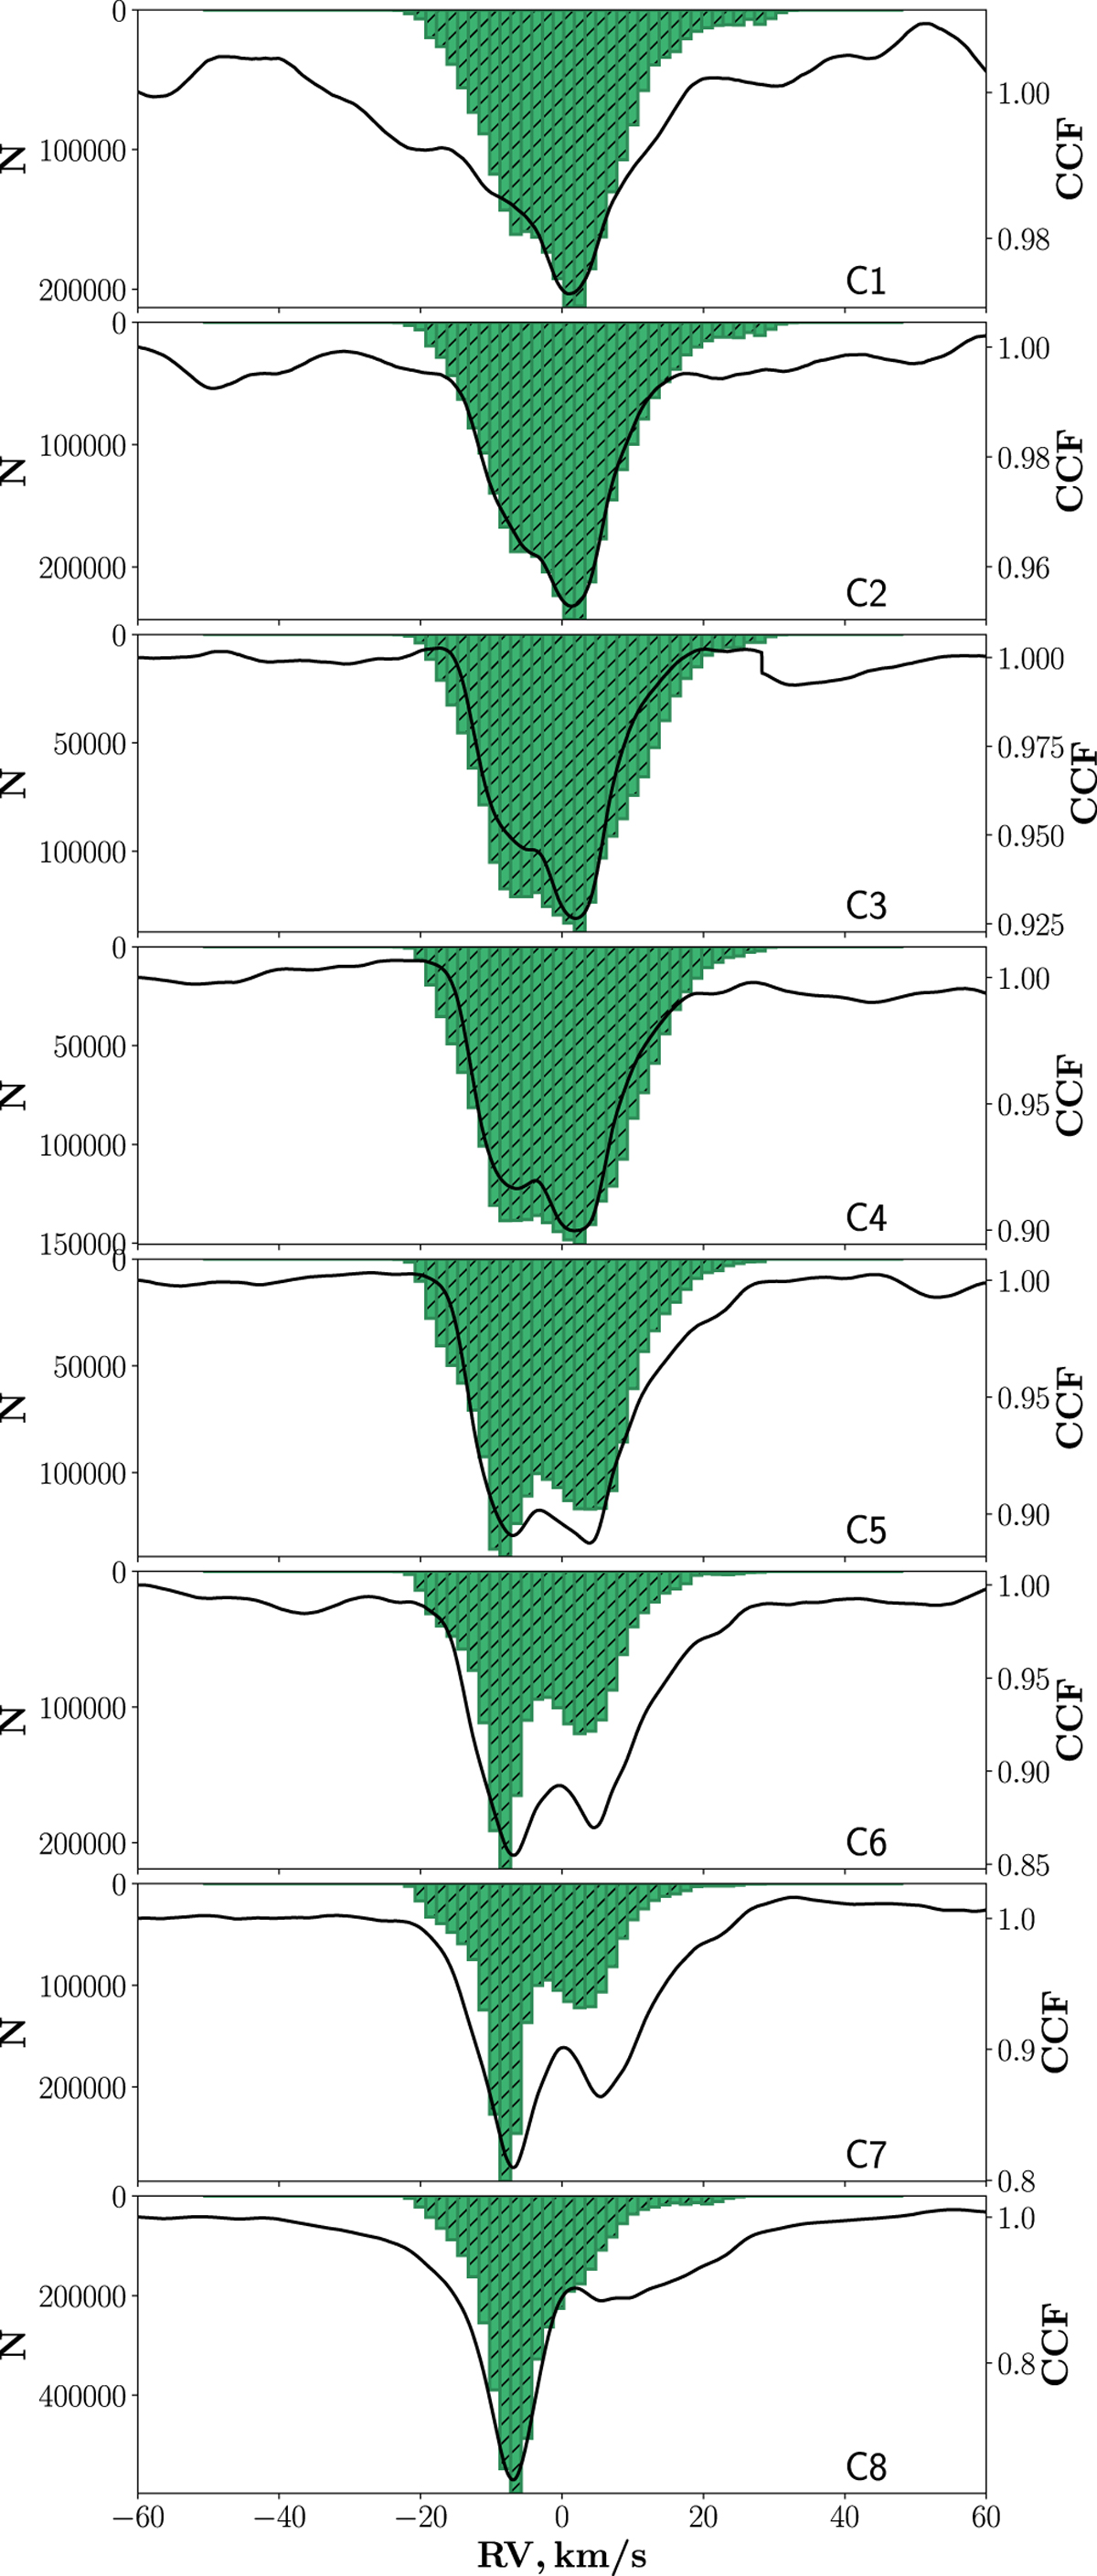
Sequence of CCF profiles (black solid line) obtained by cross-correlation of a synthetic spectrum (with included velocity field) for the whole stellar disk with tomographic masks C1–C8. Green bars show the distribution of velocities corresponding to all formation depths of lines contributing to masks C1–C8.
Current usage metrics show cumulative count of Article Views (full-text article views including HTML views, PDF and ePub downloads, according to the available data) and Abstracts Views on Vision4Press platform.
Data correspond to usage on the plateform after 2015. The current usage metrics is available 48-96 hours after online publication and is updated daily on week days.
Initial download of the metrics may take a while.