Fig. 14
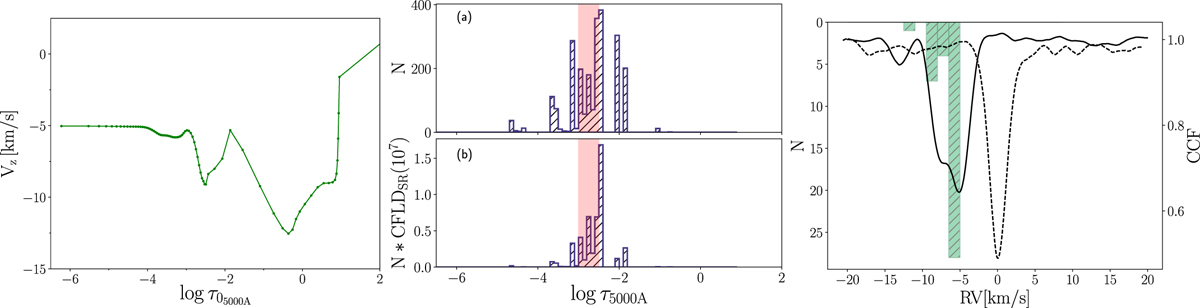
Left panel: Vz as a function of the reference optical depth for the ray 1 of the 3D simulation. Middle panel: distribution of formation depths of lines contributing to the mask C6 for the ray 1 weighted (b) and not weighted (a) by the CFLD. Right panel: CCF obtained by cross-correlation of the synthetic spectrum [with (black solid line) and without (black dashed line) including the velocity field in the 3D simulation] for the ray 1 of the 3D snapshot with the mask C6. Green bars show the distribution of velocities corresponding to formation depths of lines contributing to the mask C6.
Current usage metrics show cumulative count of Article Views (full-text article views including HTML views, PDF and ePub downloads, according to the available data) and Abstracts Views on Vision4Press platform.
Data correspond to usage on the plateform after 2015. The current usage metrics is available 48-96 hours after online publication and is updated daily on week days.
Initial download of the metrics may take a while.