Fig. 12
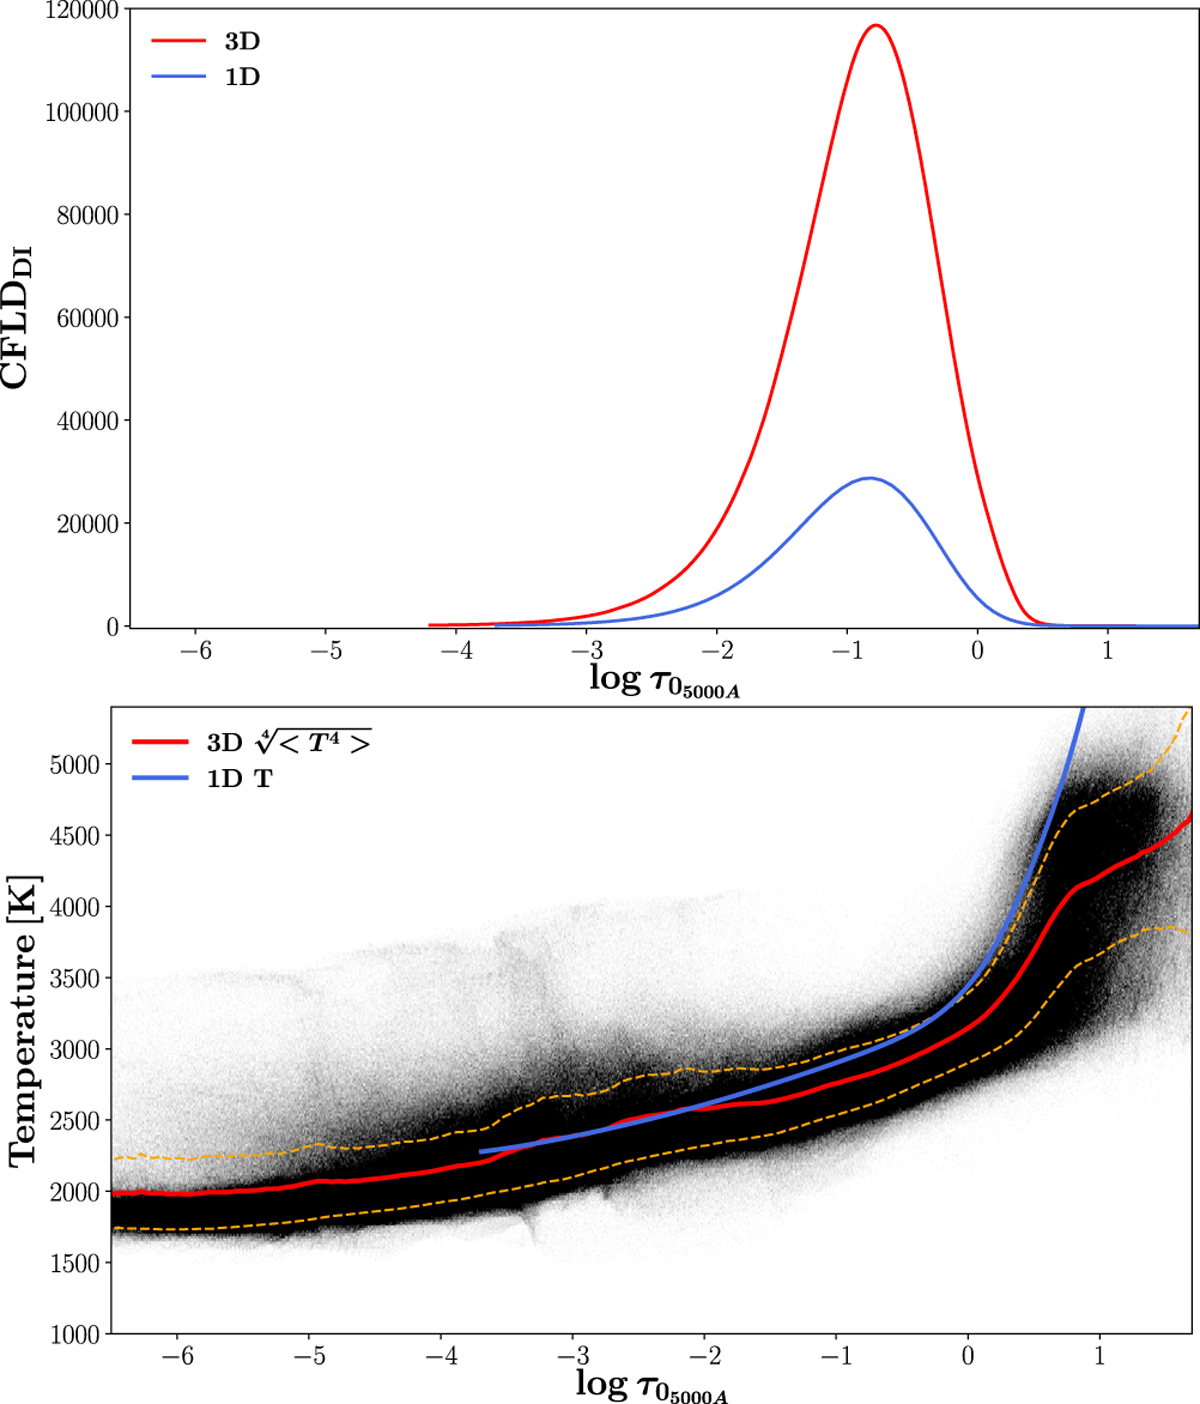
Top panel: CFLDDI for the whole stellar disk (red line) and for the 1D-RSG model of Table 1 (blue line) computed at λ = 4040.07. Bottom panel: thermal structures for all rays contributing to the stellar disk. Darker areas correspond to more frequent temperature values. The red line is the average 3D thermal profile. The orange dashed lines show the 1σ values around the average. The blue line is the 1D-RSG model thermal profile.
Current usage metrics show cumulative count of Article Views (full-text article views including HTML views, PDF and ePub downloads, according to the available data) and Abstracts Views on Vision4Press platform.
Data correspond to usage on the plateform after 2015. The current usage metrics is available 48-96 hours after online publication and is updated daily on week days.
Initial download of the metrics may take a while.