Fig. 1
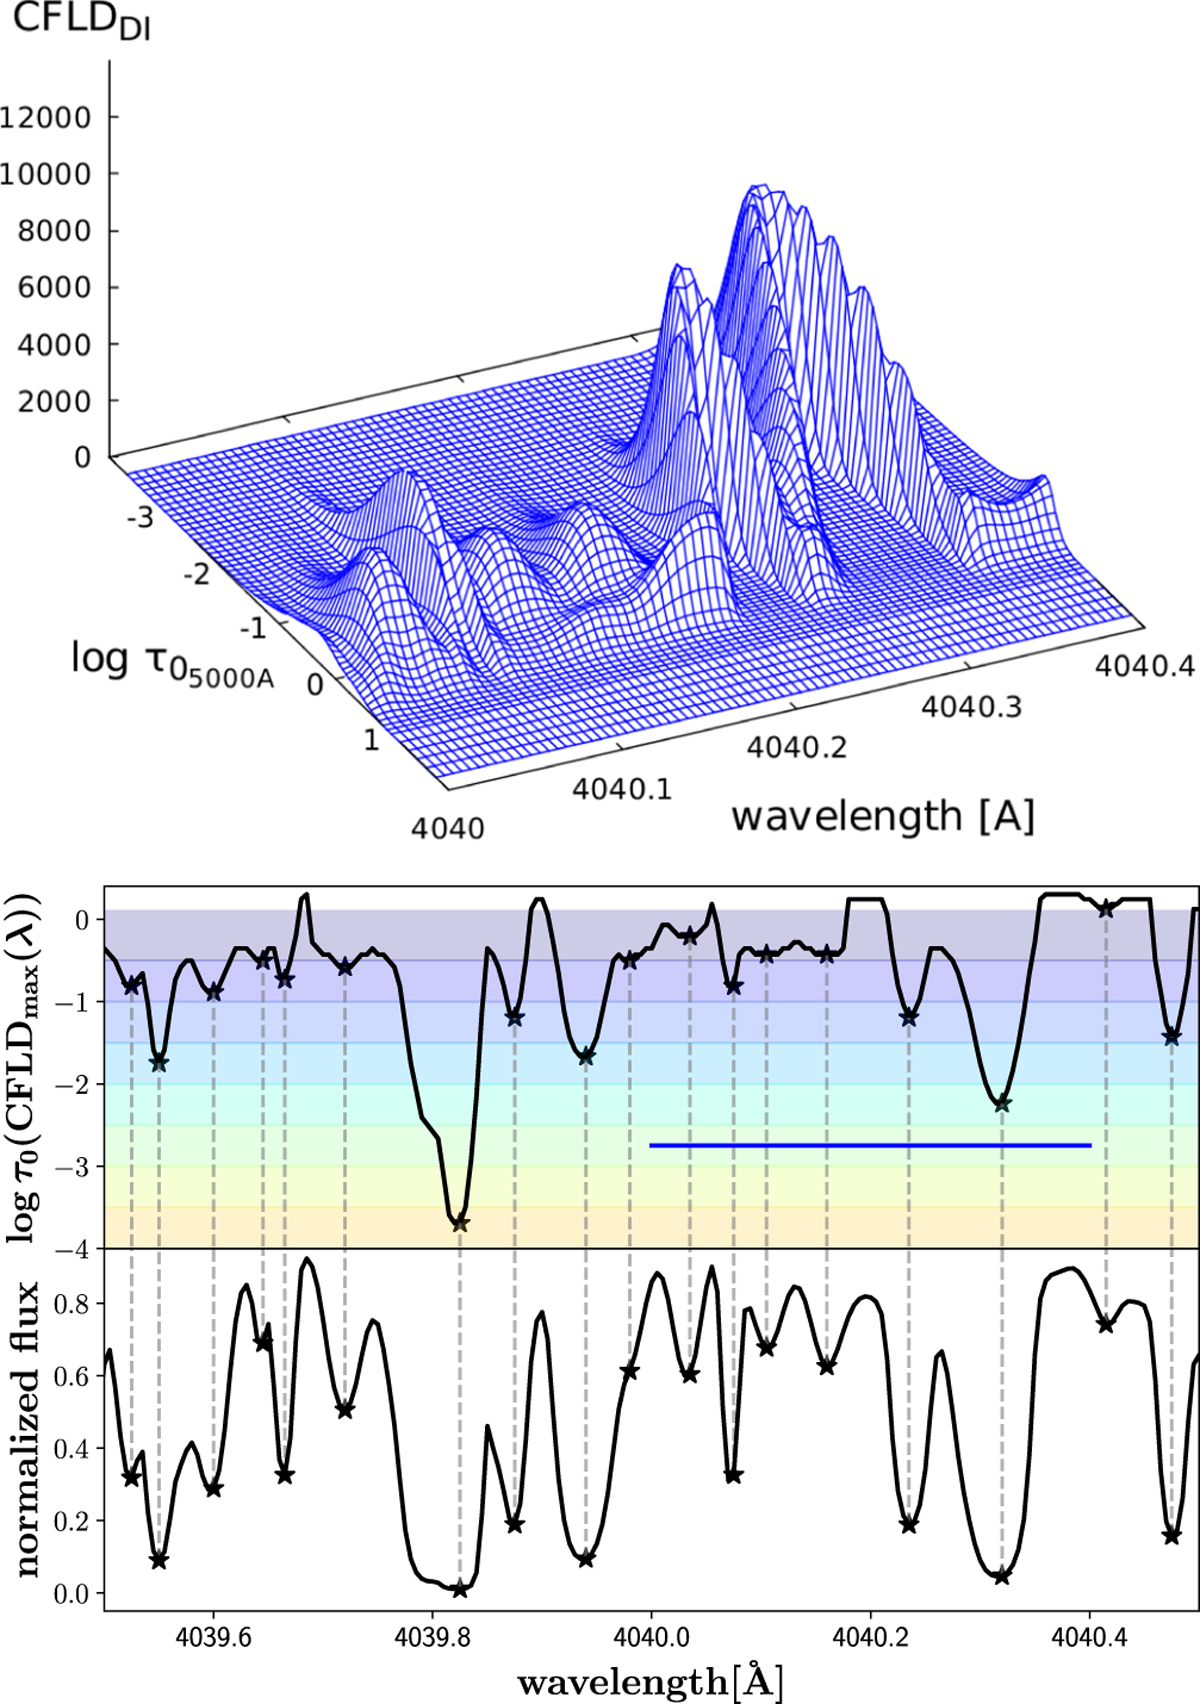
Top panel: the CFLDDI for the 1D-RSG model (Table 1). Middle panel: the depth function D (λ) ≡ log τ0 (CFLDmax (λ)) corresponding to the crest line of the CFLD in the λ − log τ0 plane. Star symbols correspond to minima of the depth function. The horizontal bands represent the log τ0 ranges spanned by the different masks. The horizontal blue line identifies the spectral interval of the displayed CFLD (top panel). Bottom panel: the corresponding synthetic spectrum.
Current usage metrics show cumulative count of Article Views (full-text article views including HTML views, PDF and ePub downloads, according to the available data) and Abstracts Views on Vision4Press platform.
Data correspond to usage on the plateform after 2015. The current usage metrics is available 48-96 hours after online publication and is updated daily on week days.
Initial download of the metrics may take a while.