Fig. 5
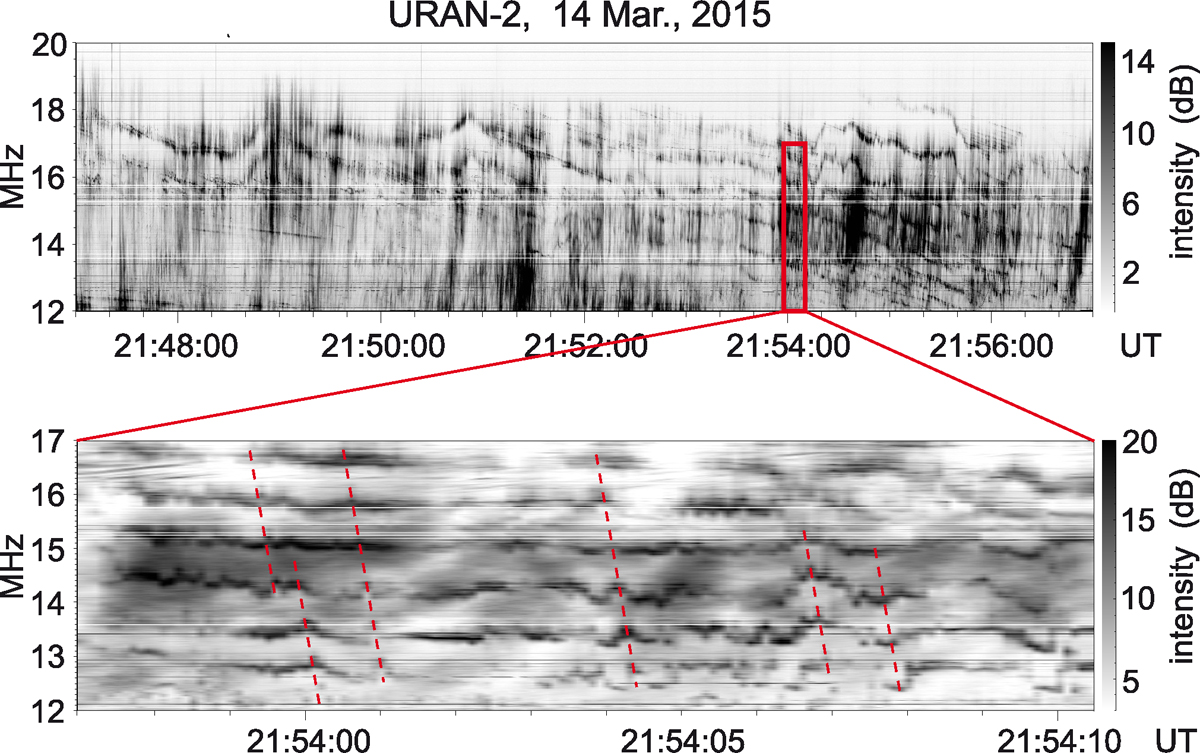
Example of the rapid oscillation in frequency of the stripes. Top panel: ZPs observed on 14 Mar., 2015, at 21:47:00–21:57:00 UT in the frequency range 12–20 MHz. Bottom panels: zoomed part (21:53:57–21:54:10.5 UT and 12–17 MHz) of the radio spectrum. Each consecutive zebra stripe is shifted by 1–2 pixels, or 100–200 ms, relative to the next stripe at lower frequency.
Current usage metrics show cumulative count of Article Views (full-text article views including HTML views, PDF and ePub downloads, according to the available data) and Abstracts Views on Vision4Press platform.
Data correspond to usage on the plateform after 2015. The current usage metrics is available 48-96 hours after online publication and is updated daily on week days.
Initial download of the metrics may take a while.