Fig. 4
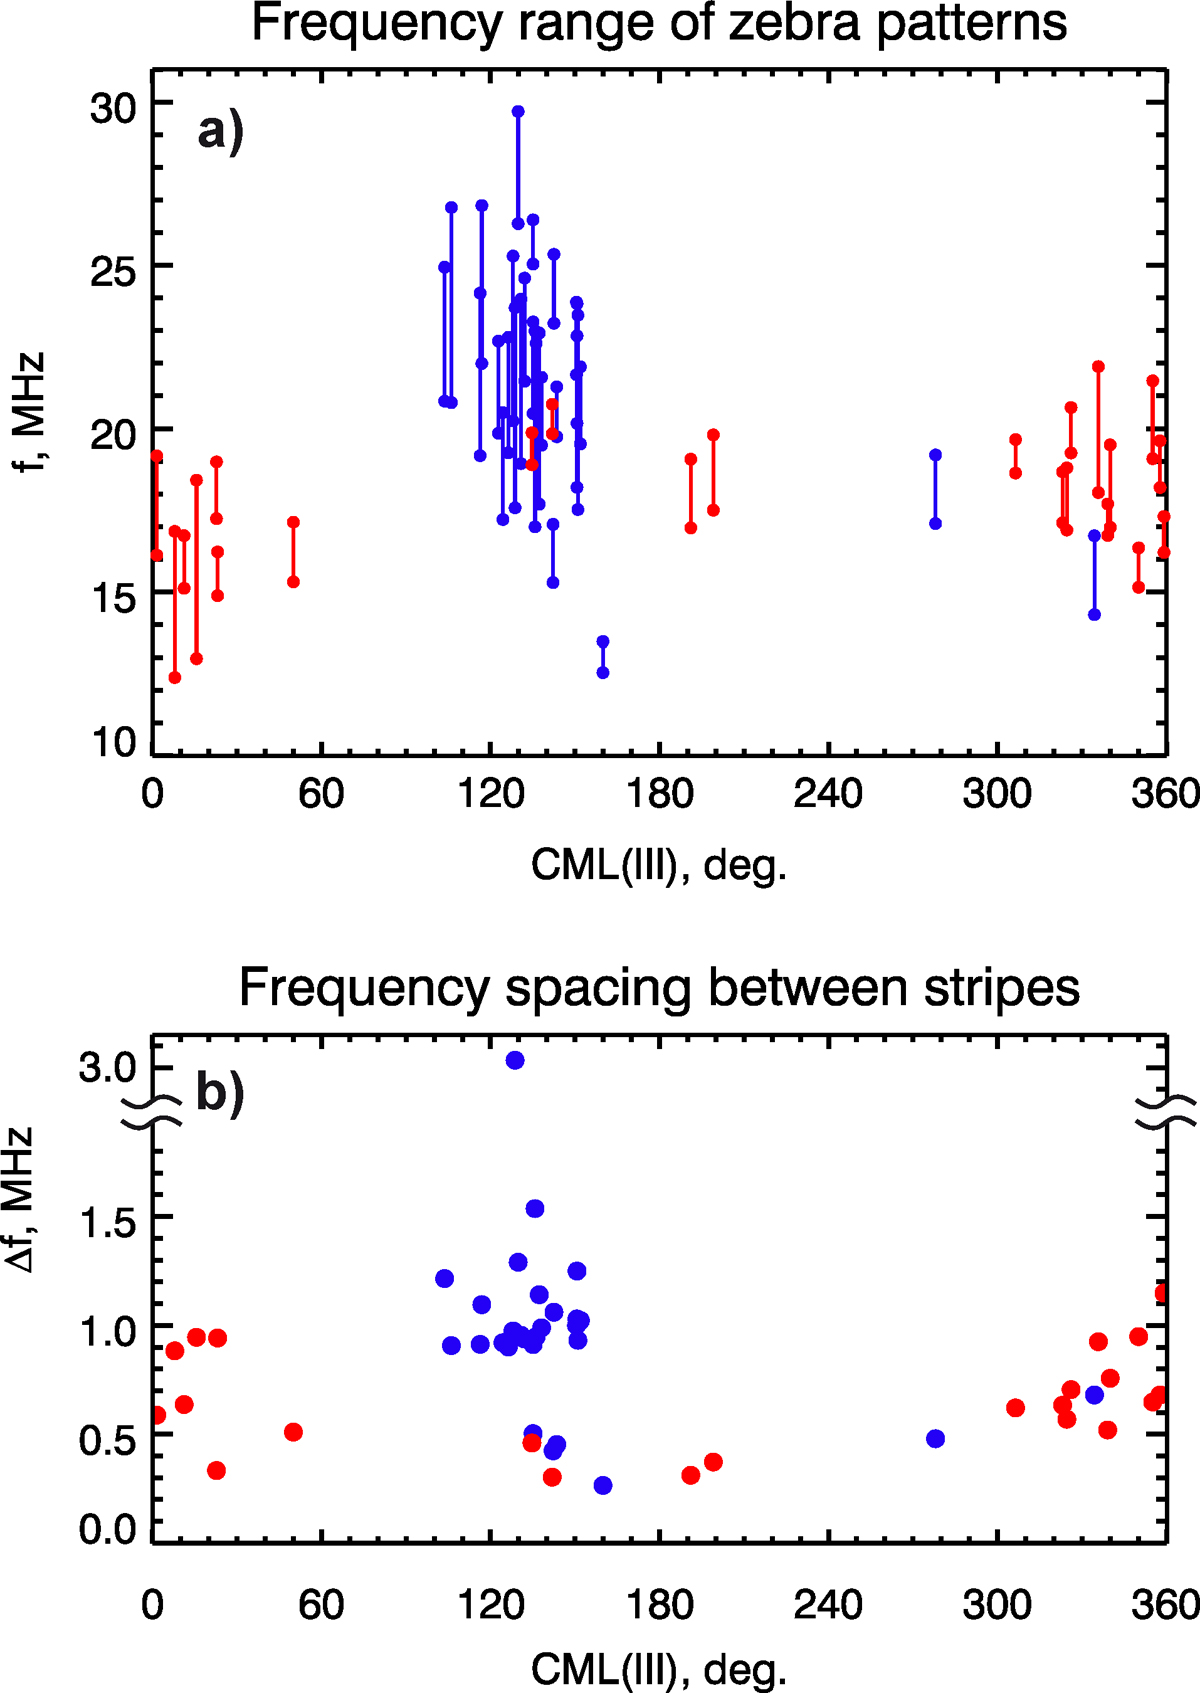
Frequency range (panel a) and frequency intervals Δf between stripes (panel b) as a function of CML. The red color indicates LH polarized ZPs and blue denotes RH polarized events. The lower markers on the bars, which denote one event in panel a, represent the minimum frequency and the upper markers indicate the highest recorded frequency of the zebra event. We note that there is the y-axis breaking between 1.8 and 2.9 MHz in panel b.
Current usage metrics show cumulative count of Article Views (full-text article views including HTML views, PDF and ePub downloads, according to the available data) and Abstracts Views on Vision4Press platform.
Data correspond to usage on the plateform after 2015. The current usage metrics is available 48-96 hours after online publication and is updated daily on week days.
Initial download of the metrics may take a while.