Fig. 7
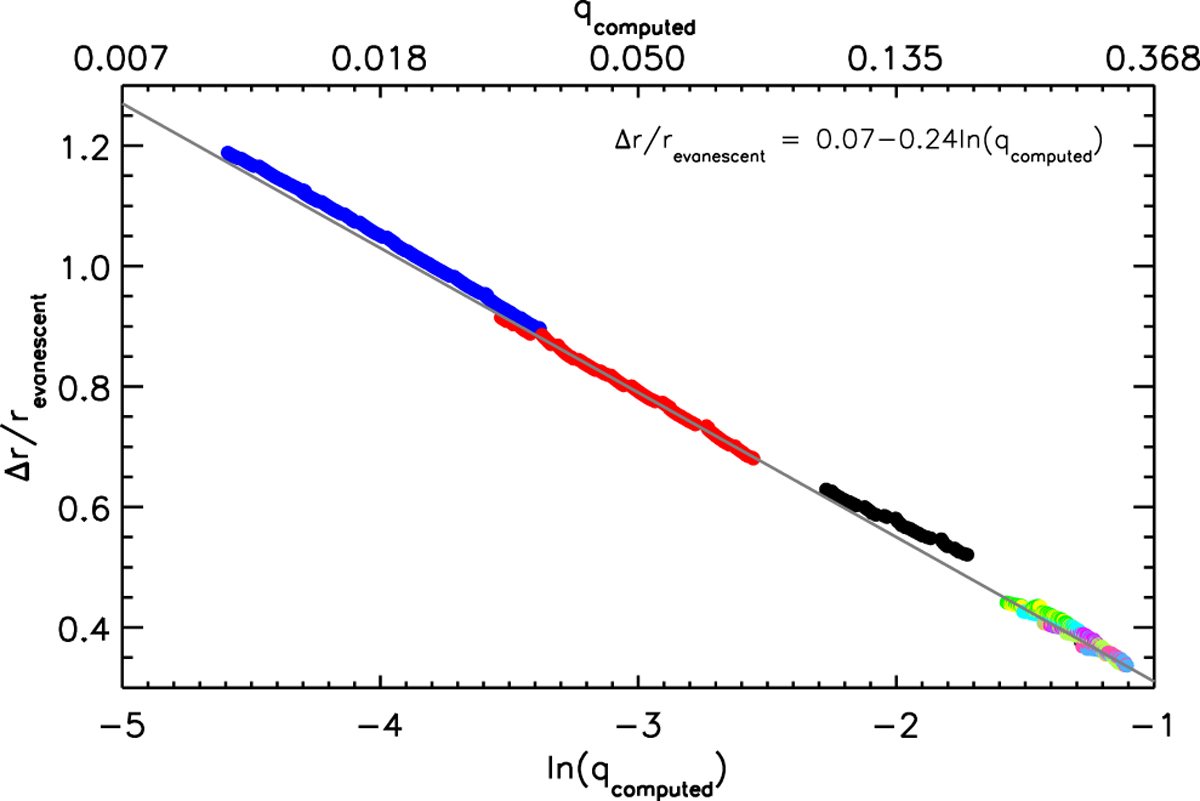
Radial extent of the evanescent zone (Δ r) normalised by the radius of the midpoint of the evanescent zone (revanescent) vs. the natural logarithm of the coupling factor (![]() ) for each frequency in the frequency range νmax ± 3.5Δν computed using Eqs. (9)–(11). The colour-coding is the same as in Fig. 6. The grey line indicates the fit as indicated in the legend (see text for more details). The values of qcomputed are shown in the top axis.
) for each frequency in the frequency range νmax ± 3.5Δν computed using Eqs. (9)–(11). The colour-coding is the same as in Fig. 6. The grey line indicates the fit as indicated in the legend (see text for more details). The values of qcomputed are shown in the top axis.
Current usage metrics show cumulative count of Article Views (full-text article views including HTML views, PDF and ePub downloads, according to the available data) and Abstracts Views on Vision4Press platform.
Data correspond to usage on the plateform after 2015. The current usage metrics is available 48-96 hours after online publication and is updated daily on week days.
Initial download of the metrics may take a while.