Fig. 6
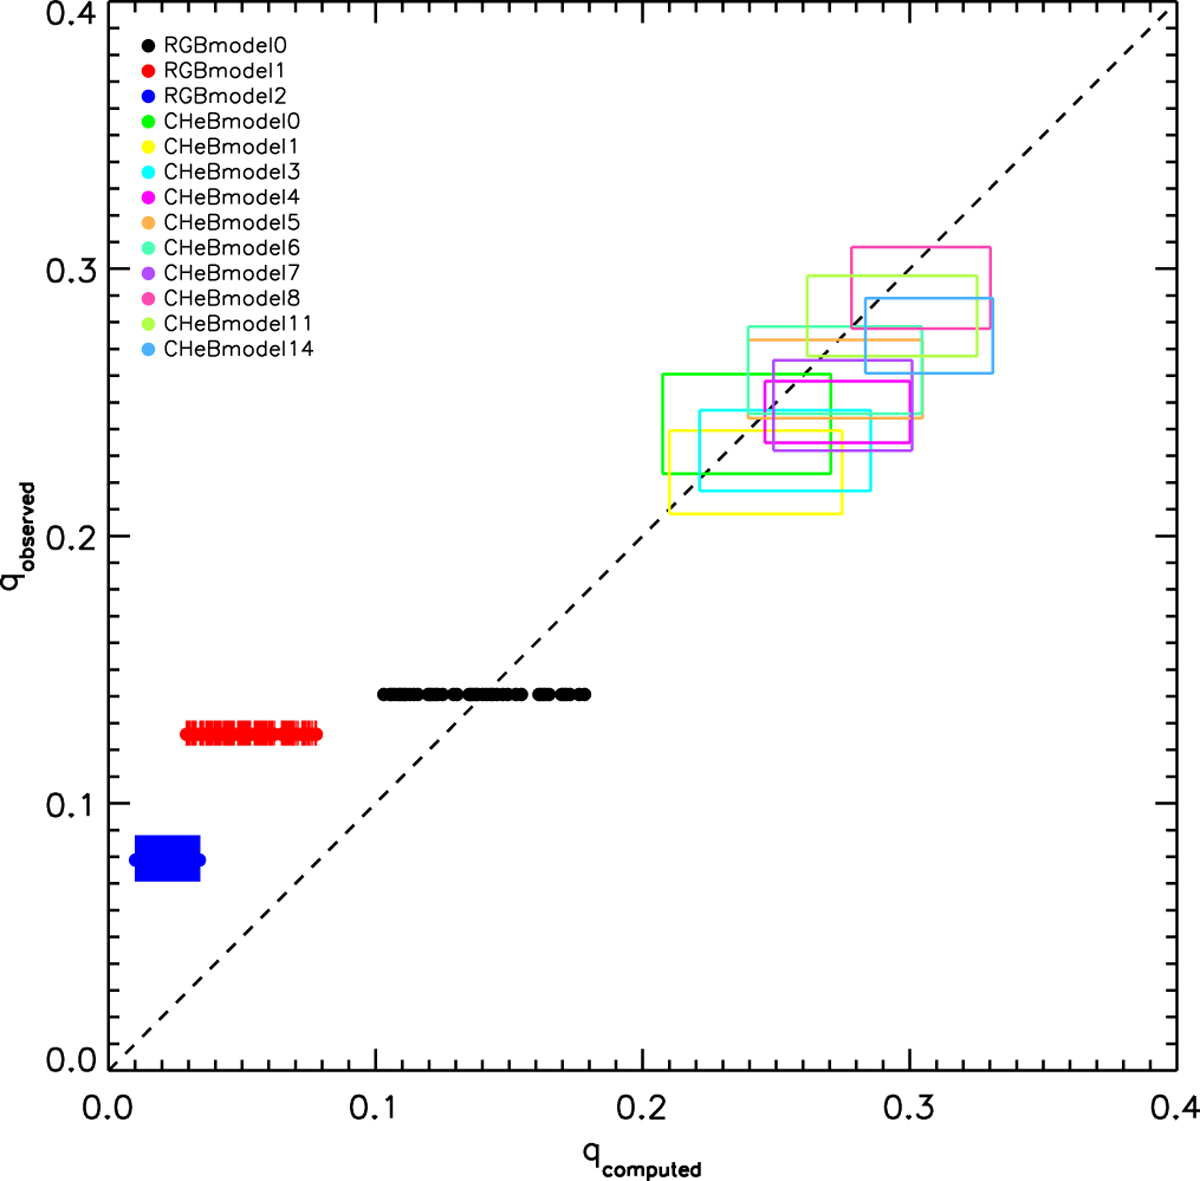
Coupling factor computed using the method outlined in Sect. 2 (qobserved) vs. the coupling factor for each frequency computedusing Eqs. (9)–(11) (qcomputed). For visual purposes we show the individual points with uncertainties for the RGB models, and a rectangle for the CHeB models that comprises the results including the uncertainties for that particular model; the horizontal width of each rectangular box indicates the spread in q computed through Eqs. (9)–(11) for all frequencies in a range of five times Δ ν centred around νmax. The legends show the colour with which each model is indicated.
Current usage metrics show cumulative count of Article Views (full-text article views including HTML views, PDF and ePub downloads, according to the available data) and Abstracts Views on Vision4Press platform.
Data correspond to usage on the plateform after 2015. The current usage metrics is available 48-96 hours after online publication and is updated daily on week days.
Initial download of the metrics may take a while.