Fig. 4
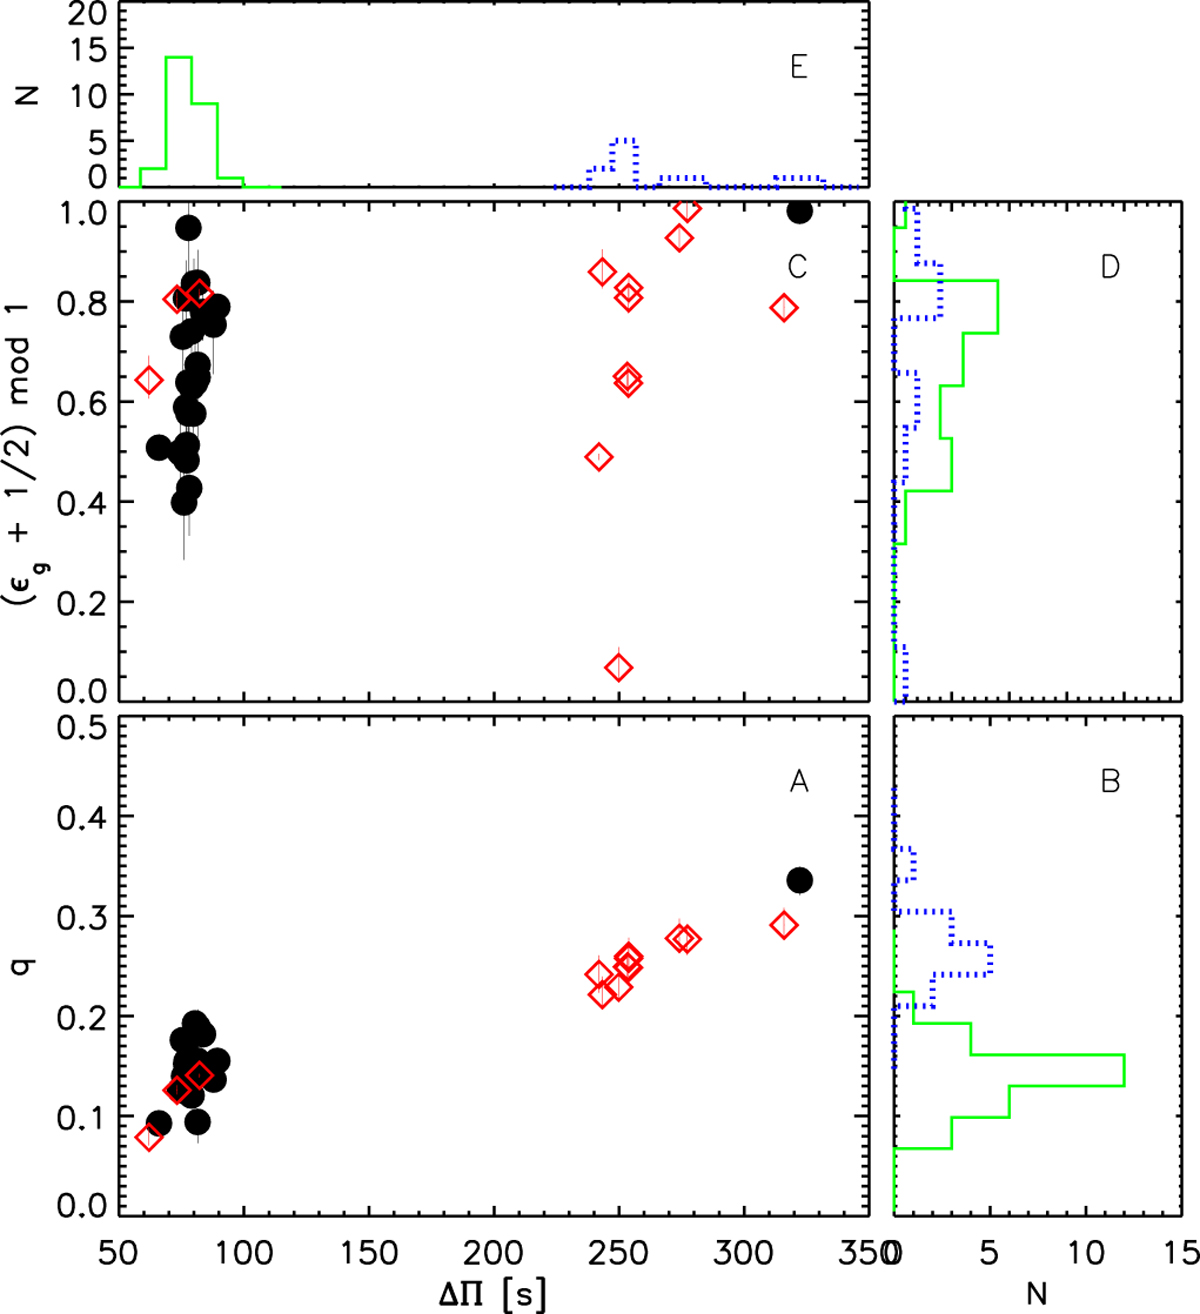
Panel A: coupling factor q vs. Δ Π for all objects. Real stars are indicated with black dots and models with red diamonds. Panel B: histogram of q for RGB stars (real stars + models) and CHeB stars in green solid and blue dotted lines, respectively. Panel C: as in panel A, now for ((ϵg + 1∕2) mod 1) vs. Δ Π . Panel D: distribution of (ϵg + 1∕2) mod 1. Panel E: the distribution of Δ Π results. The colour-coding and line styles in panels D and E are the same as in panel B. In panels A and C, uncertainties are over plotted. These are, however, in a number of cases smaller than the symbol size.
Current usage metrics show cumulative count of Article Views (full-text article views including HTML views, PDF and ePub downloads, according to the available data) and Abstracts Views on Vision4Press platform.
Data correspond to usage on the plateform after 2015. The current usage metrics is available 48-96 hours after online publication and is updated daily on week days.
Initial download of the metrics may take a while.