Fig. 1
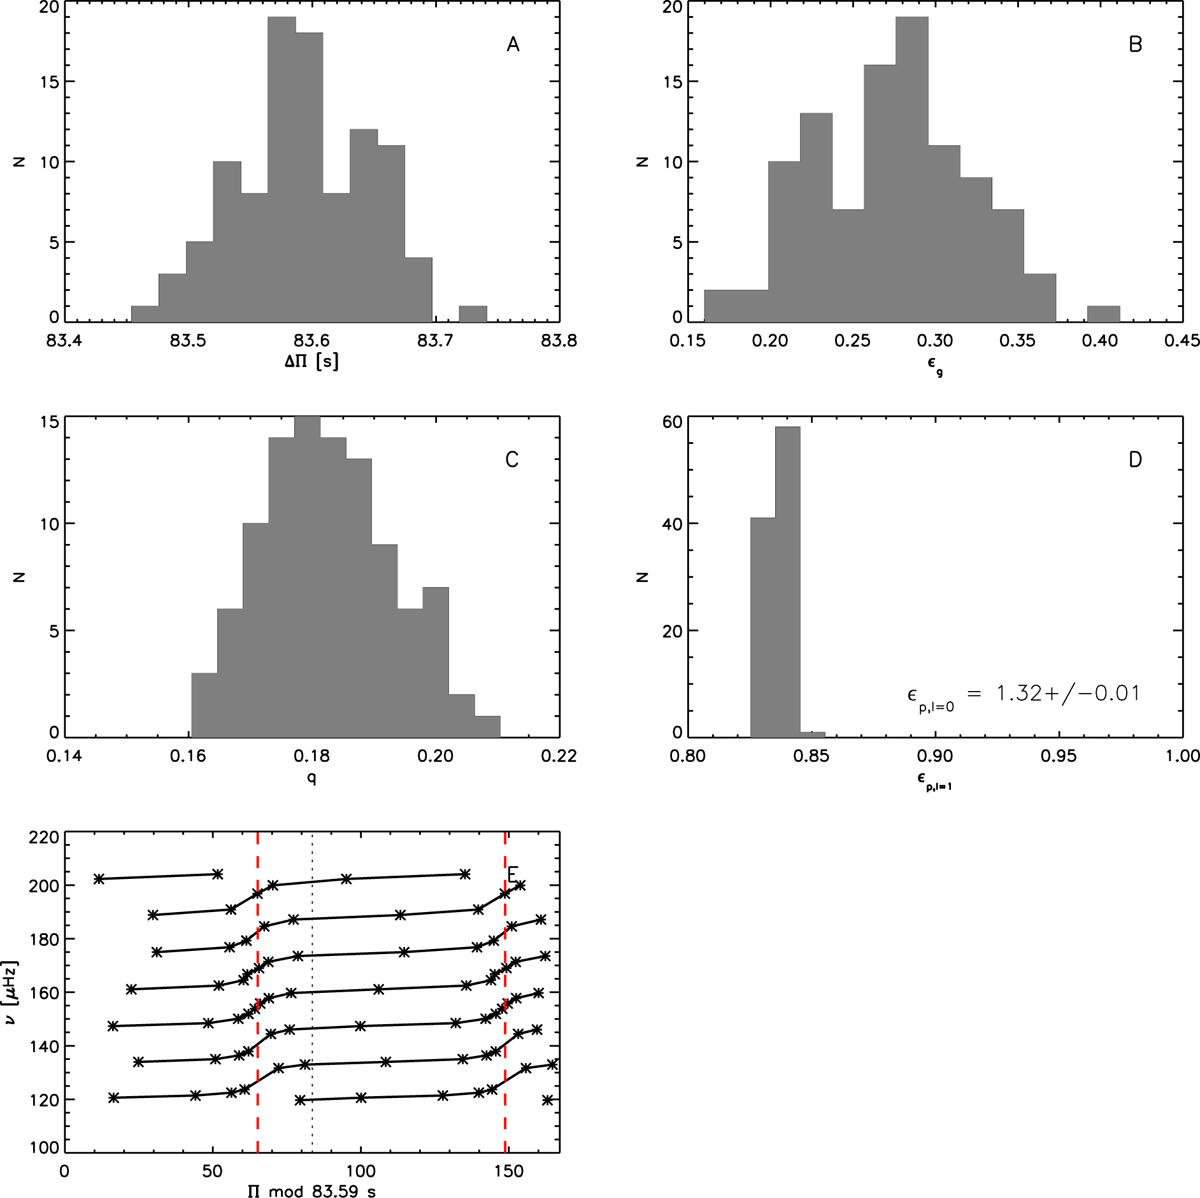
Results for KIC 10123207 using the frequencies from Corsaro et al. (2015). Panels A–D: histograms of Δ Π, ϵg, q, and ϵp 1 (see Introduction for the meaning of these parameters). The ϵp 0 value determined from radial modes is indicated in the legend of panel D. A period-échelle diagram using the Δ Π obtained in this work is shown in panel E. The vertical red dashed lines indicate ((ϵg + 0.5) mod 1) *ΔΠ, that is, the position of the most g-dominated modes according to the fitted values. We note that the period-échelle diagram is shown twice separated by the dotted vertical line.
Current usage metrics show cumulative count of Article Views (full-text article views including HTML views, PDF and ePub downloads, according to the available data) and Abstracts Views on Vision4Press platform.
Data correspond to usage on the plateform after 2015. The current usage metrics is available 48-96 hours after online publication and is updated daily on week days.
Initial download of the metrics may take a while.