Fig. 7
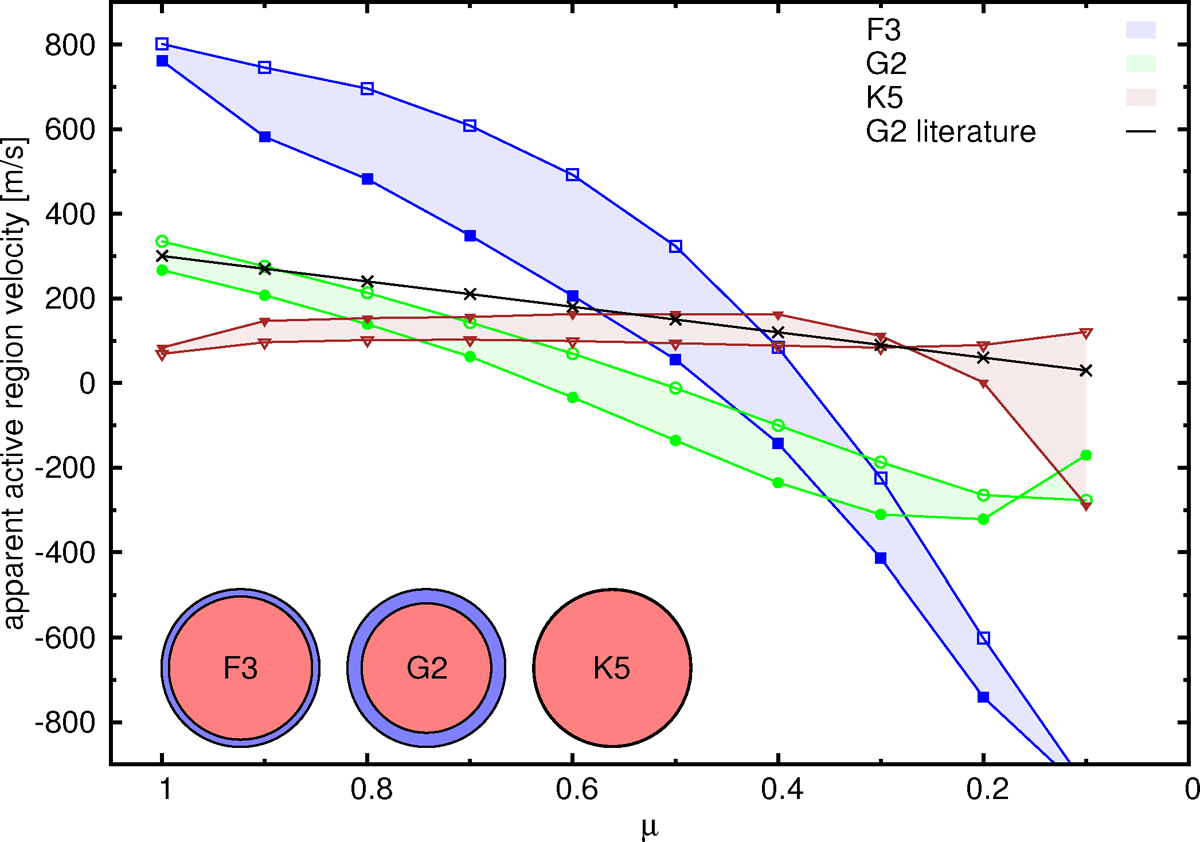
Variation of the active region velocity field between B = 0 and B = 500 G as a functionof μ for the F3 star (blue squares), G2 star (green circles), and the K5 star (red triangles). The results of the FeI line at 6165 Å is shown with open symbols and the result of the FeI line at 6173 Å is indicatedas filled symbols. For comparison the constant active region velocity field taking into account only the projection effect with μ (as done in previous works) is plotted as black line. Red-blue circles in the bottom left indicate where on the stellar disk active regions appear redshifted or blueshifted relative to the quiet photosphere.
Current usage metrics show cumulative count of Article Views (full-text article views including HTML views, PDF and ePub downloads, according to the available data) and Abstracts Views on Vision4Press platform.
Data correspond to usage on the plateform after 2015. The current usage metrics is available 48-96 hours after online publication and is updated daily on week days.
Initial download of the metrics may take a while.