Free Access
Fig. 6
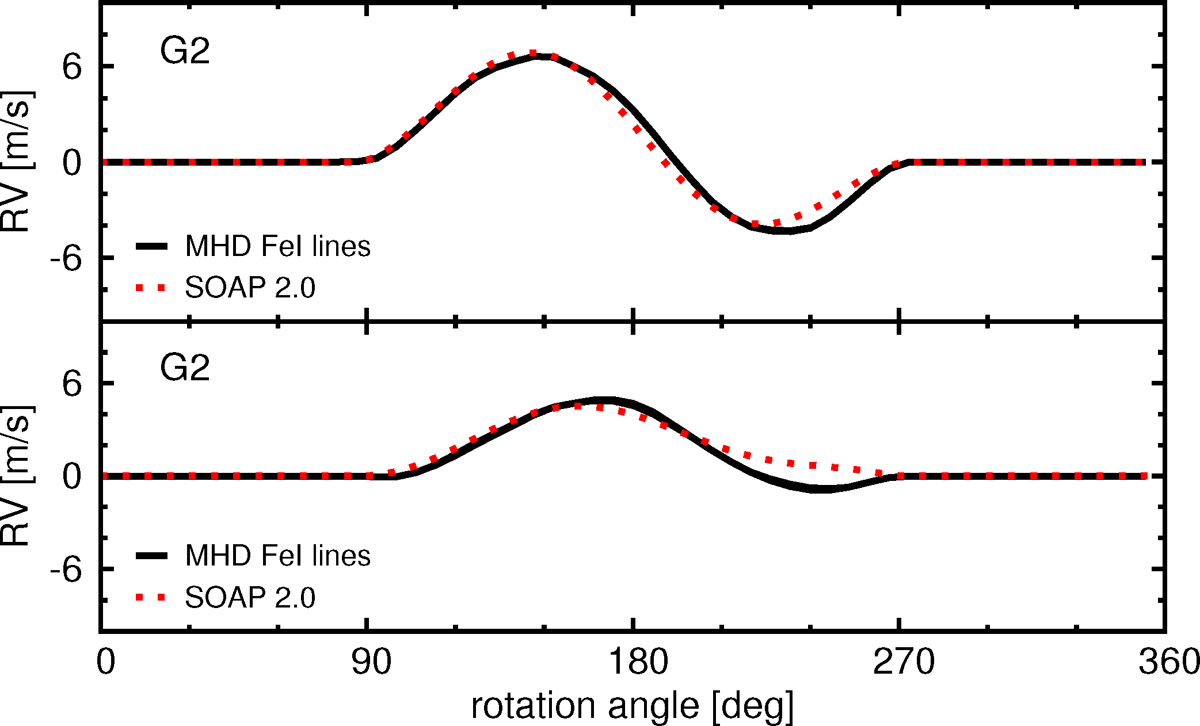
Comparison between the RV curves derived by our code using the MHD line profiles (black solid lines) and SOAP 2.0 (red dotted lines) for a dark spot (upper panel) and a bright plage (lower panel).
Current usage metrics show cumulative count of Article Views (full-text article views including HTML views, PDF and ePub downloads, according to the available data) and Abstracts Views on Vision4Press platform.
Data correspond to usage on the plateform after 2015. The current usage metrics is available 48-96 hours after online publication and is updated daily on week days.
Initial download of the metrics may take a while.