Fig. 5
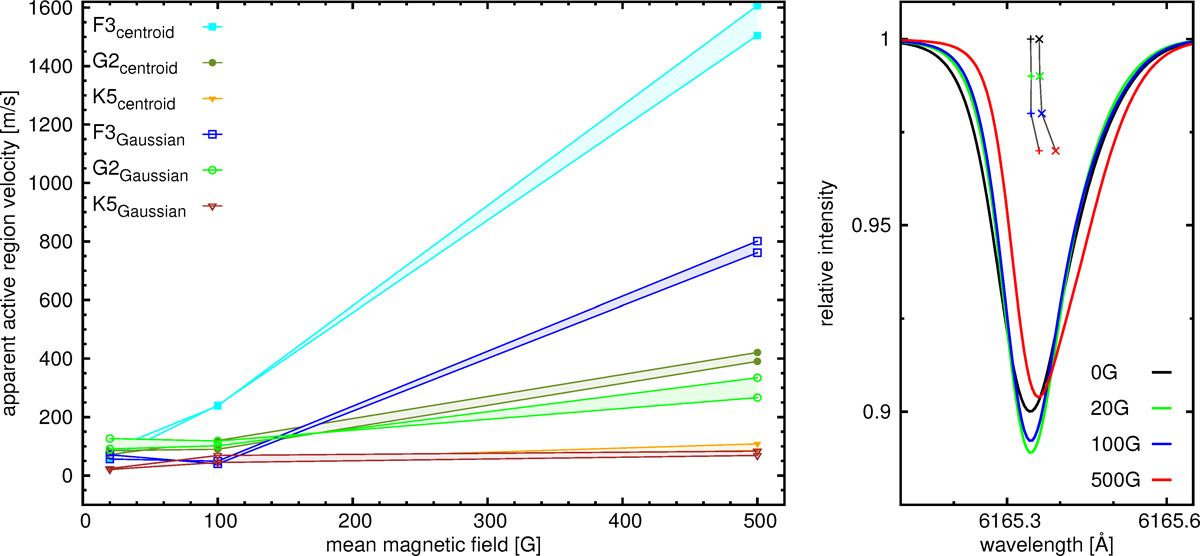
Left panel: variation of the active region velocity with the magnetic field strength B for different stellar types and measurement methods. Right panel: MHD line profile of the FeI line at 6165 Å for different magnetic field strength (solid lines) and line center measurements with the Gaussian method (crosses) and the centroid method (x). The color code for the line profiles and the center measurements are the same: black for B = 0 G, green for B = 20 G, blue for B =100 G, and red for B = 500 G.
Current usage metrics show cumulative count of Article Views (full-text article views including HTML views, PDF and ePub downloads, according to the available data) and Abstracts Views on Vision4Press platform.
Data correspond to usage on the plateform after 2015. The current usage metrics is available 48-96 hours after online publication and is updated daily on week days.
Initial download of the metrics may take a while.