Fig. 2
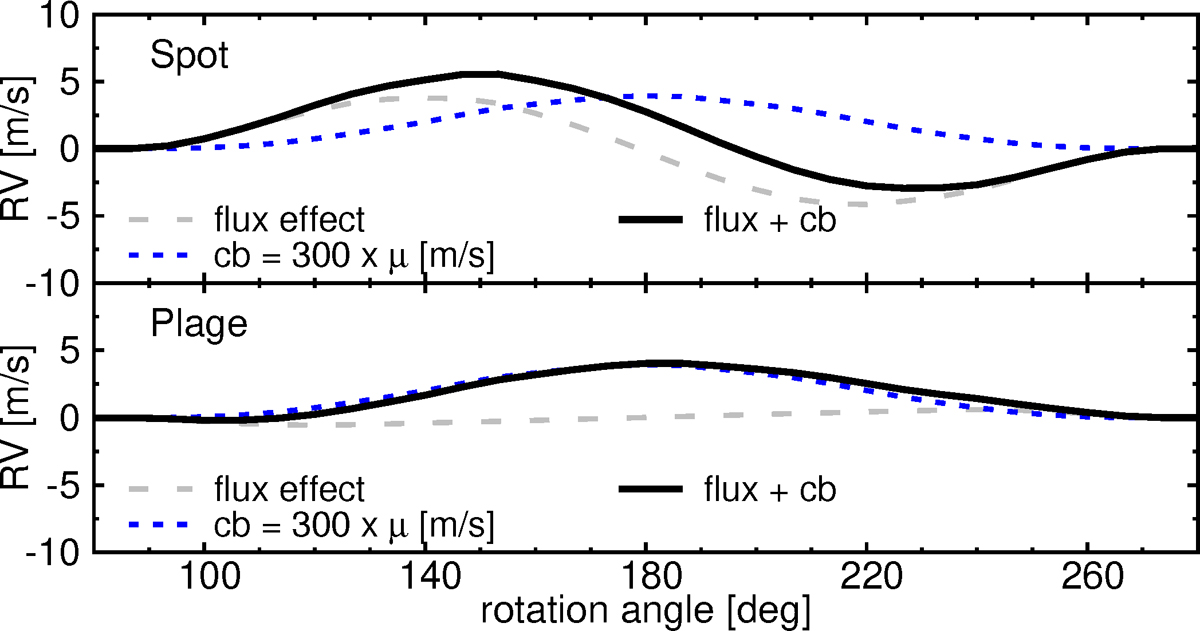
Upperpanel: spot RV curve produced by the flux effect only (gray dashed line), the RV curve produced by the active region by only suppressing the convective blueshift (blue dashed line) and the spot RV curve produced by taking into account the flux effect and the suppression of convection (black solid line). Lower panel: RV curves for the bright plage plotted in the same way as for the dark spot in the upper panel.
Current usage metrics show cumulative count of Article Views (full-text article views including HTML views, PDF and ePub downloads, according to the available data) and Abstracts Views on Vision4Press platform.
Data correspond to usage on the plateform after 2015. The current usage metrics is available 48-96 hours after online publication and is updated daily on week days.
Initial download of the metrics may take a while.