Fig. 12
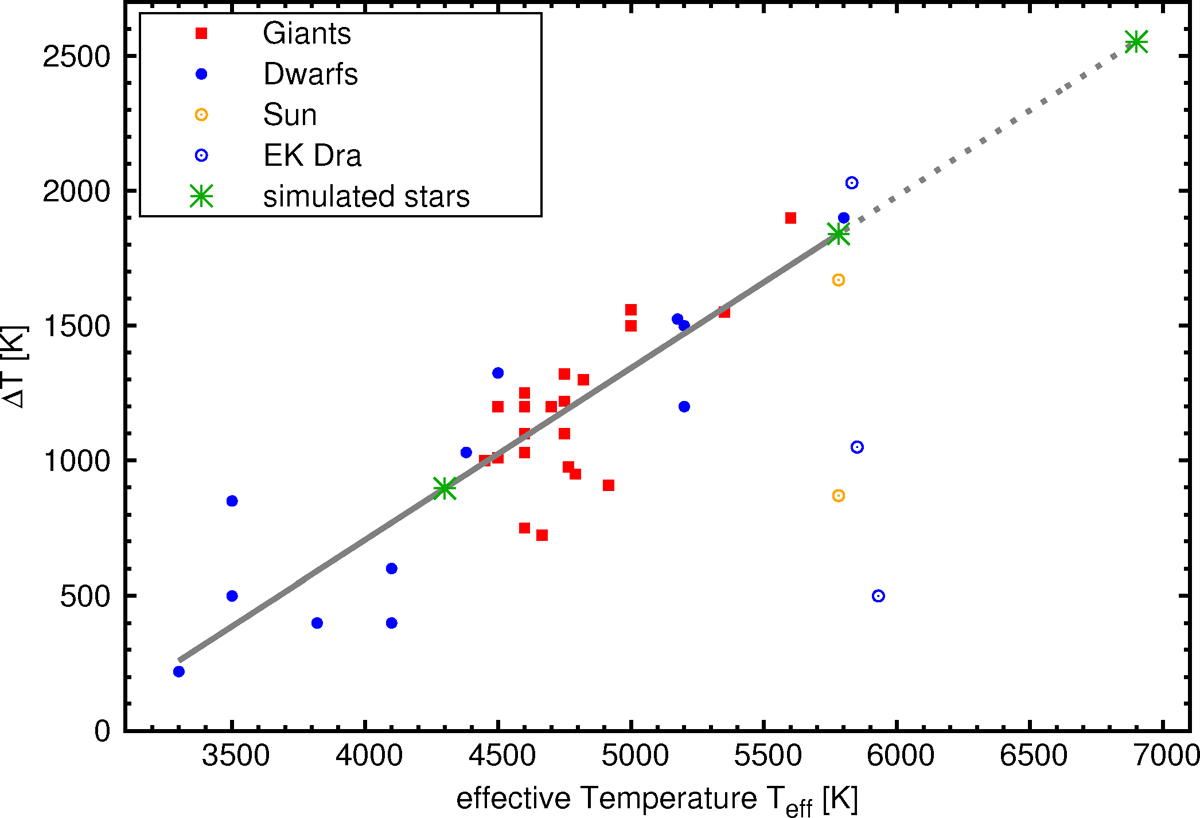
Measured spot temperatures in red giants (red filled squares) and main sequence dwarfs (blue filled circles). Measurements of the Suns umbra and penumbra are shown as yellow open circles and EK Dra is shown as blue open circle. All values are taken from Berdyugina (2005). Our fit to the data is indicated as gray line and our simulated stars are indicated as green star symbols.
Current usage metrics show cumulative count of Article Views (full-text article views including HTML views, PDF and ePub downloads, according to the available data) and Abstracts Views on Vision4Press platform.
Data correspond to usage on the plateform after 2015. The current usage metrics is available 48-96 hours after online publication and is updated daily on week days.
Initial download of the metrics may take a while.