Fig. 11
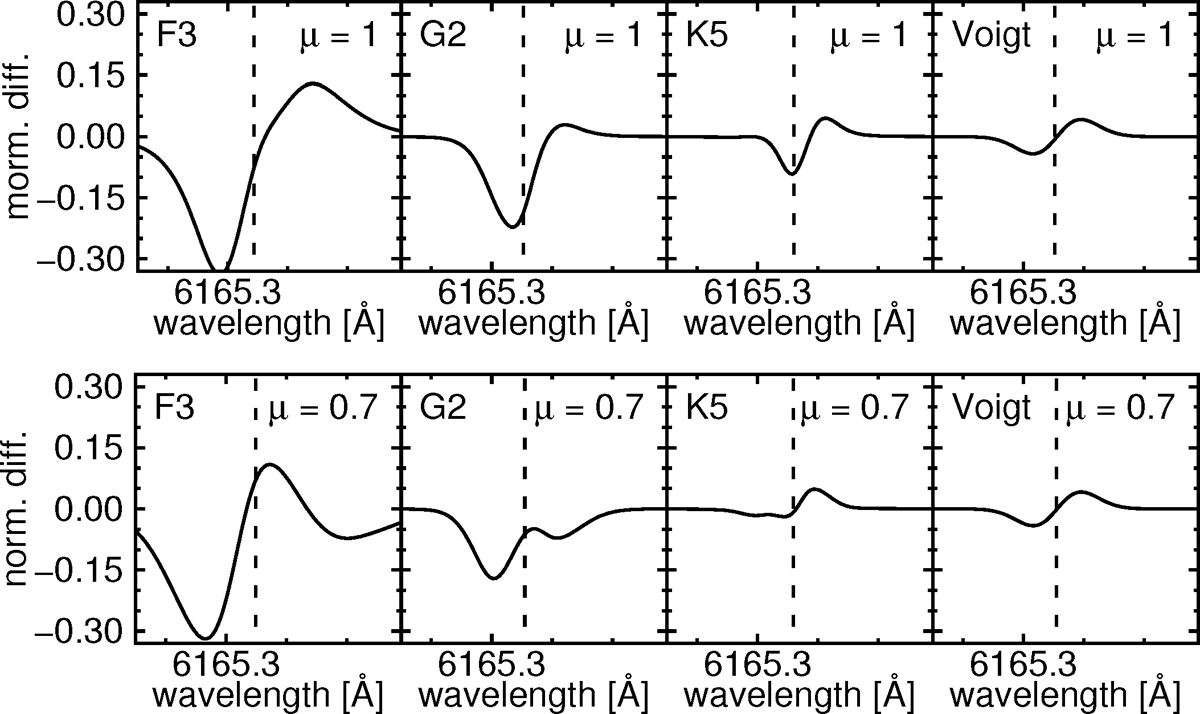
Difference between the B = 500 G and B = 0 G line profiles normalized by the line depth of the B = 0 G line. Panel from left to right show the result for the F3, G2, K5 MHD lines, respectively. The rightmost panel depicts results from the cb(μ) simulation using Voigt profiles with solar parameters. Upper panels: results at μ = 1. Lower panel:results at μ = 0.7.
Current usage metrics show cumulative count of Article Views (full-text article views including HTML views, PDF and ePub downloads, according to the available data) and Abstracts Views on Vision4Press platform.
Data correspond to usage on the plateform after 2015. The current usage metrics is available 48-96 hours after online publication and is updated daily on week days.
Initial download of the metrics may take a while.