Fig. 9
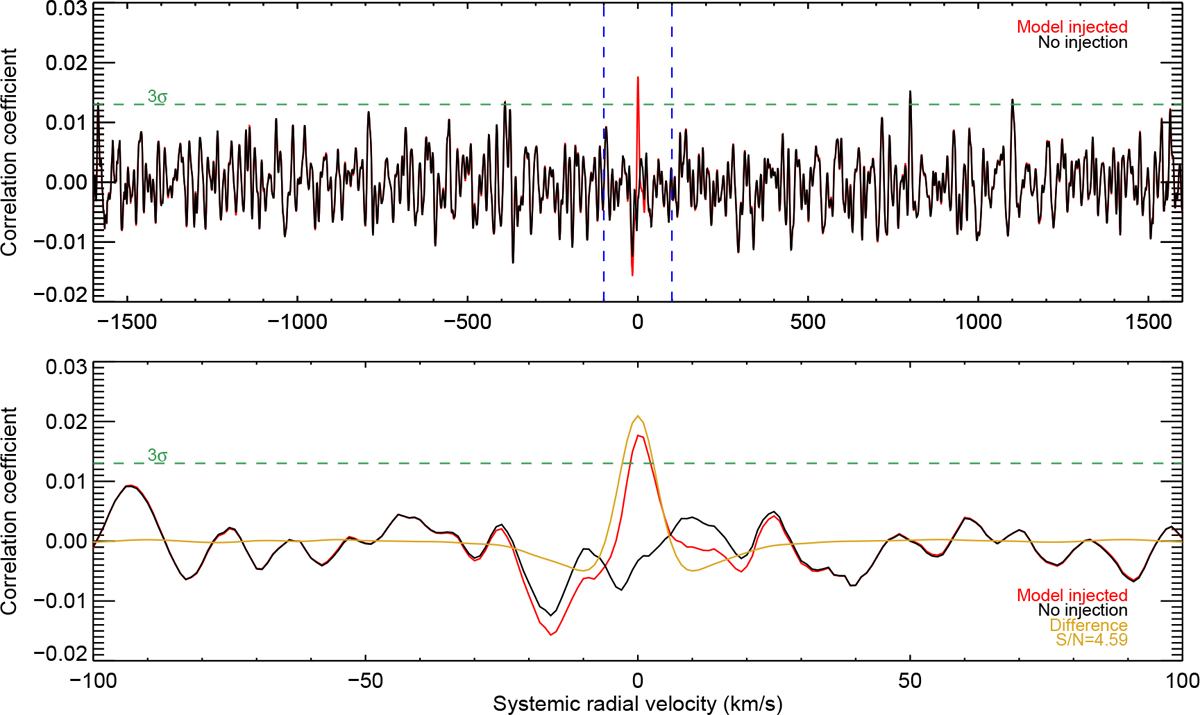
The 1D cross-correlation function after stacking all exposures in all orders of all datasets. Top panel: entire cross-correlation function between ± 1600 km s−1, bottom panel: zoom-in around ± 100 km s−1 for clarity. The red and black lines represent the injected and non-injected data, respectively. The gold line is the difference between the two, and the dashed horizontal line is 3σ away fromthe mean of cross-correlation (which is around zero). The model was injected at a strength of 2 × 10⁻⁵ Φ(α), and is retrieved at a level of 4.6σ. The corresponding 3σ upper limit of ϵ is 1.5 × 10⁻⁵, taking into account a factor 0.87 to correct for the efficiency at which the PHOENIX template correlates with the stellar spectrum (see Sect. 3.2).
Current usage metrics show cumulative count of Article Views (full-text article views including HTML views, PDF and ePub downloads, according to the available data) and Abstracts Views on Vision4Press platform.
Data correspond to usage on the plateform after 2015. The current usage metrics is available 48-96 hours after online publication and is updated daily on week days.
Initial download of the metrics may take a while.