Fig. 7
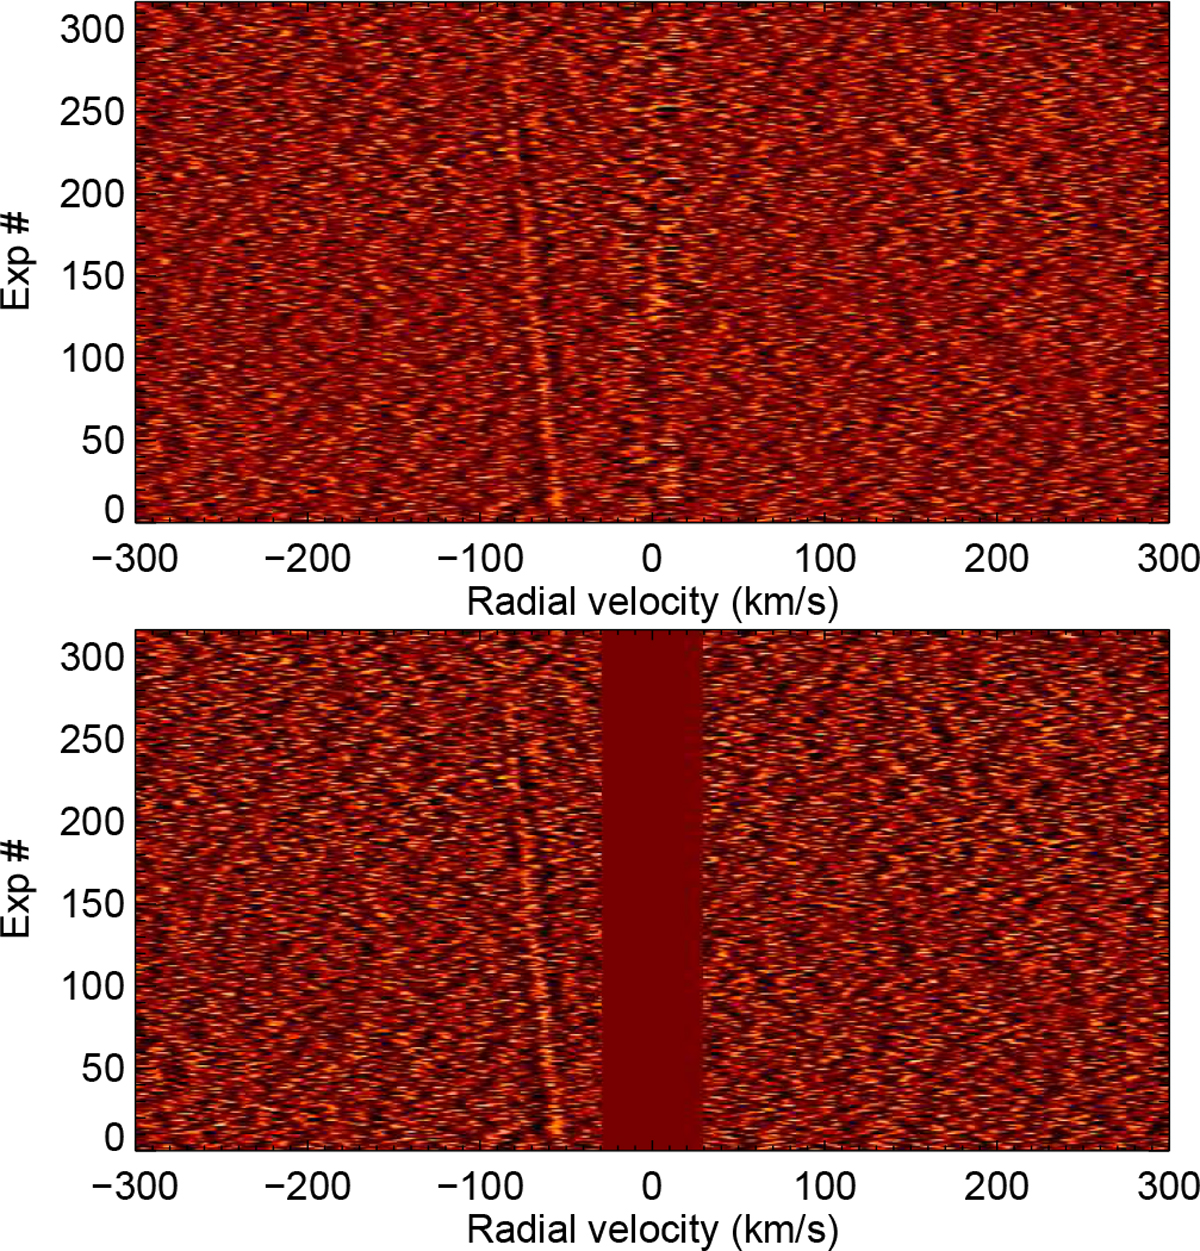
Upper panel: combined cross-correlation function of a spectral order of the second UVES night. For illustrative purposes, the planet’s spectrum was injected into these data at ϵ = 1 ×10⁻³ to show the slanted cross-correlation peak around − 80 km s−1 due to the changing radial velocity of the planet during the observations. The vertical structure at 0 km s−1 is caused by residual correlation with remnants of the stellar spectrum. Lower panel: same data but with the residual stellar structure at 0 km s−1 masked out. This will prevent it from contaminating non-zero radial-velocities when co-adding the individual cross-correlations at the rest-frame of the planet.
Current usage metrics show cumulative count of Article Views (full-text article views including HTML views, PDF and ePub downloads, according to the available data) and Abstracts Views on Vision4Press platform.
Data correspond to usage on the plateform after 2015. The current usage metrics is available 48-96 hours after online publication and is updated daily on week days.
Initial download of the metrics may take a while.