Fig. 8
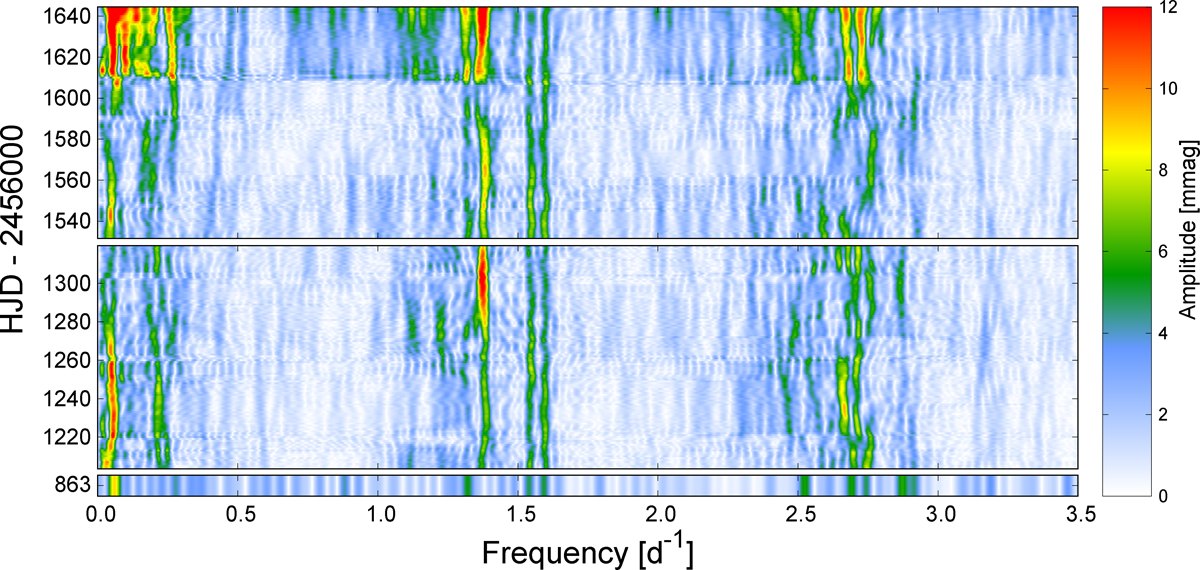
Time vs. frequency diagrams for the BRITE red-filter photometry of 28 Cyg in 2014. The bottom panel shows a single time bin, the middle panel shows 2015, and the top panel represents 2016. The discrete Fourier transform frequency spectra werecalculated in 40-day intervals with a step of 1 d. The common amplitude scale appears on the right. Horizontal lines occur where data from different set-ups were stitched together. It should be noted that the diffuse appearance of fΔ32 (0.05 c/d) and f1 (1.38 c/d, the Štefl frequency) and the cyclic anti-phased variability of the two g modes f2 (1.54 c/d) and f3 (1.60 c/d).
Current usage metrics show cumulative count of Article Views (full-text article views including HTML views, PDF and ePub downloads, according to the available data) and Abstracts Views on Vision4Press platform.
Data correspond to usage on the plateform after 2015. The current usage metrics is available 48-96 hours after online publication and is updated daily on week days.
Initial download of the metrics may take a while.