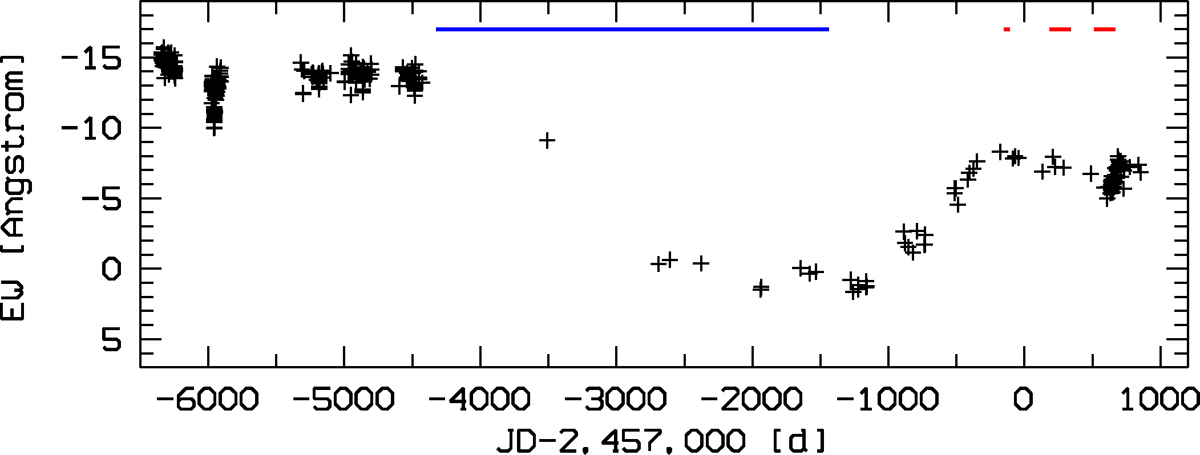
Fig. 18

Hα equivalentwidths in HEROS (Tubbesing et al. 2000, and unpublished; JD < 2 453 000) and BeSS (Neiner et al. 2011; JD > 2 453 000) spectra. Negative values mean net line emission. The 1σ scatter around JD 2452 000 is 0.5 Å; for BeSS errors see Fig. 20. The short red horizontal bars near the top right corner denote the BRITE observations. The long blue bar spans the SMEI observations.
Current usage metrics show cumulative count of Article Views (full-text article views including HTML views, PDF and ePub downloads, according to the available data) and Abstracts Views on Vision4Press platform.
Data correspond to usage on the plateform after 2015. The current usage metrics is available 48-96 hours after online publication and is updated daily on week days.
Initial download of the metrics may take a while.


