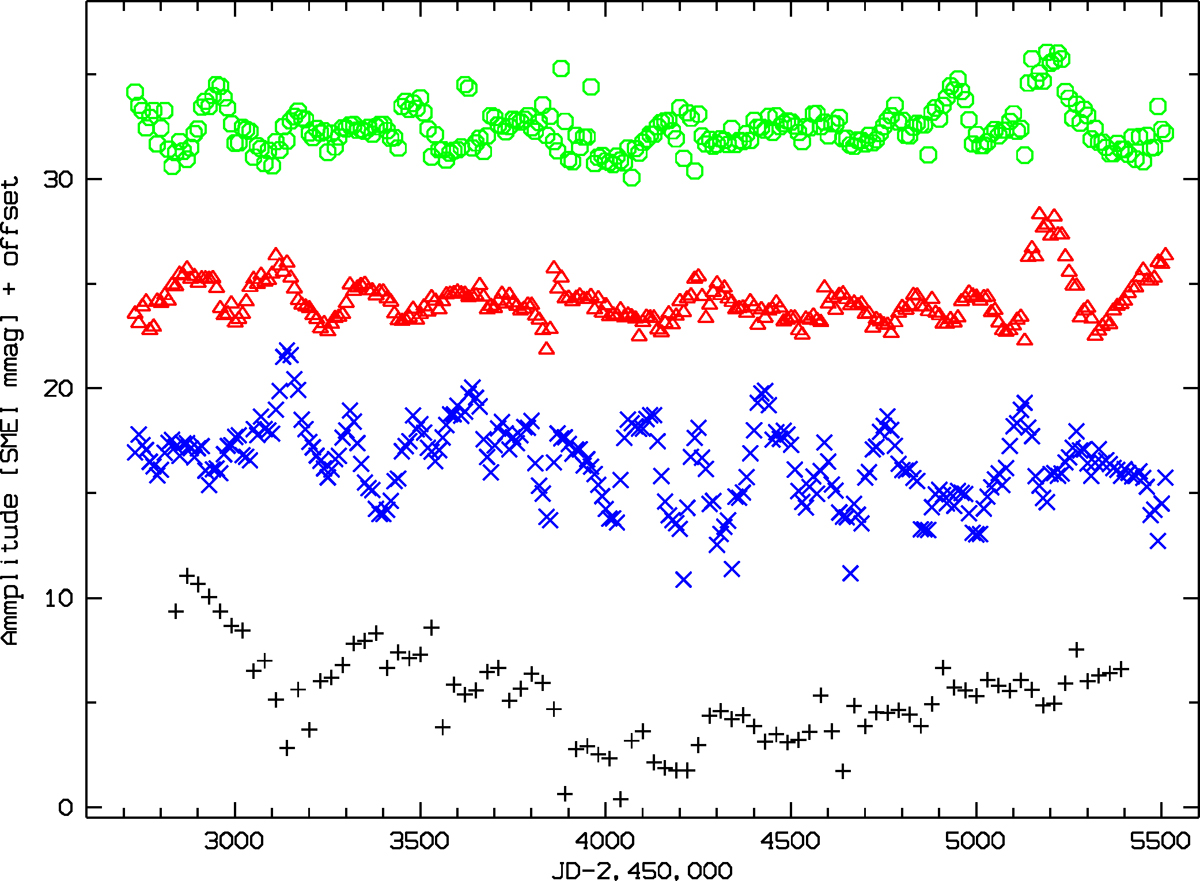
Fig. 16

Time-amplitude diagram for fΔ32 (black +), f1 (×), f2 (triangles), and f3 (°) in the SMEI data. The semi-amplitudes were derived from fits of single sine functions over windows of 100 d (fΔ32 : 300 d) stepped by 10 d (fΔ32: 30 d). From bottom to top, the curves are vertically shifted by 0, 10, 20, and 30 mmag, respectively.
Current usage metrics show cumulative count of Article Views (full-text article views including HTML views, PDF and ePub downloads, according to the available data) and Abstracts Views on Vision4Press platform.
Data correspond to usage on the plateform after 2015. The current usage metrics is available 48-96 hours after online publication and is updated daily on week days.
Initial download of the metrics may take a while.


