Fig. 11
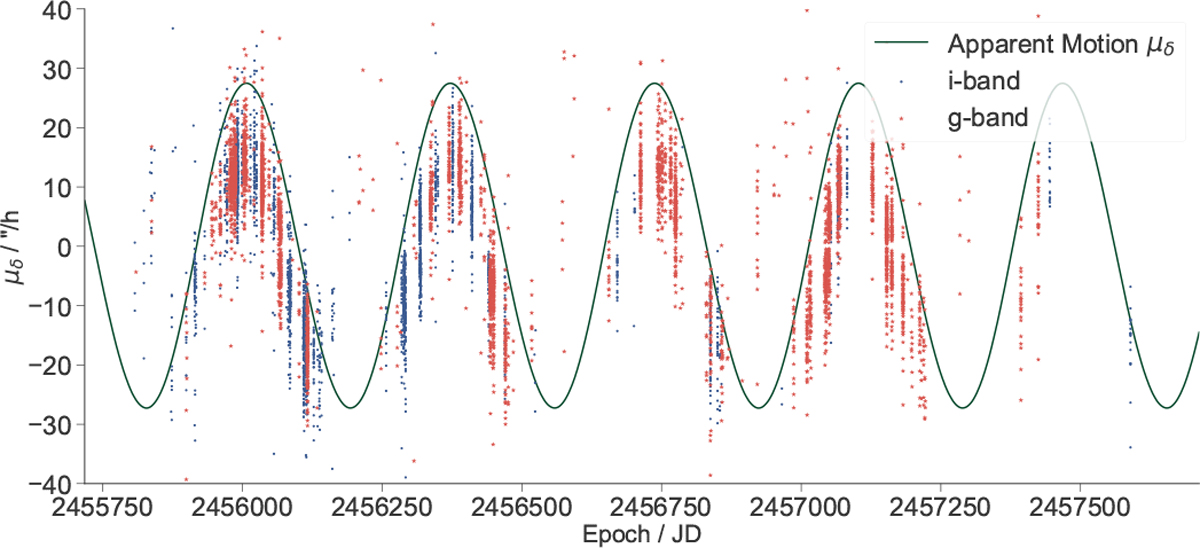
Observation epochs of KiDS in the g and i band vs. time: the distributions of observation epochs for the different filters result in different distributions of the proper motion of SSOs (Fig. 10). The red stars mark the observed proper motions in declination over time for all SSOs observed in the g band. The blue dots show the same distribution for the i band. The apparent motion component of this proper motion due to Earth’s movement about the Sun is shown as a green line. For details on this approximation, refer to text.
Current usage metrics show cumulative count of Article Views (full-text article views including HTML views, PDF and ePub downloads, according to the available data) and Abstracts Views on Vision4Press platform.
Data correspond to usage on the plateform after 2015. The current usage metrics is available 48-96 hours after online publication and is updated daily on week days.
Initial download of the metrics may take a while.