Fig. 5
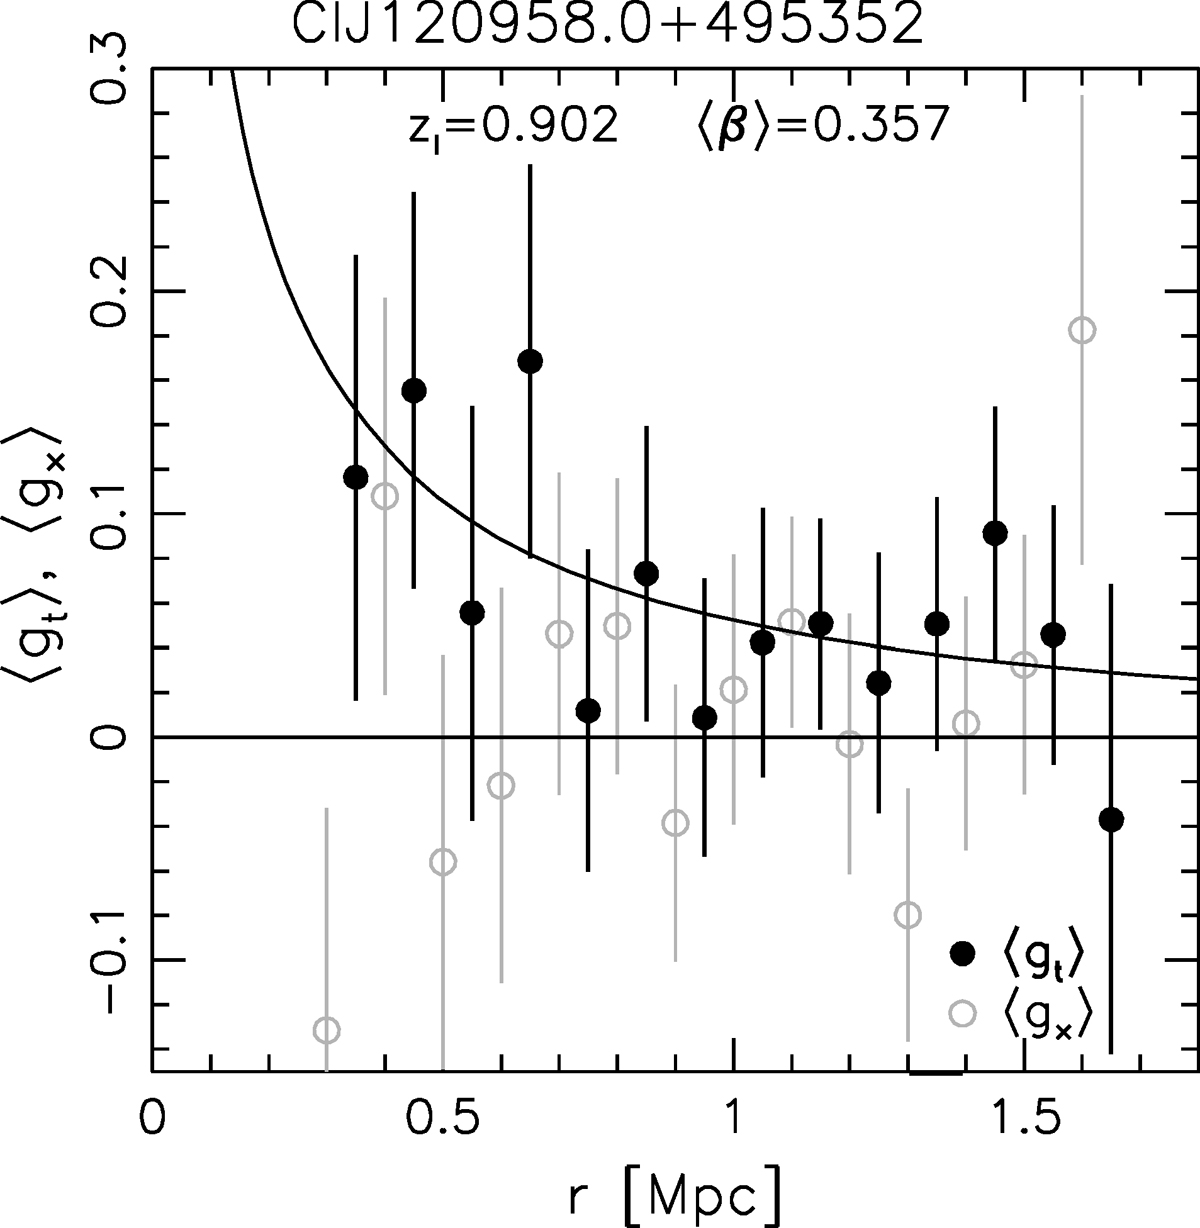
Tangential reduced shear profile (black solid circles) of Cl J120958.9+495352, measured around the X-ray peak. Here we combine the profiles of four magnitude bins between 24 < V606,aper < 26, as done in S16. The curve shows the corresponding best fitting NFW model prediction constrained by fitting the data within the range 300 kpc ≤ r ≤ 1.5 Mpc, assuming the mass-concentration relation from Diemer & Kravtsov (2015). The gray open circles indicate the reduced cross-shear component, which has been rotated by 45 degrees and constitutes a test for systematics. These points have been shifted by dr = −0.05 Mpc for clarity.
Current usage metrics show cumulative count of Article Views (full-text article views including HTML views, PDF and ePub downloads, according to the available data) and Abstracts Views on Vision4Press platform.
Data correspond to usage on the plateform after 2015. The current usage metrics is available 48-96 hours after online publication and is updated daily on week days.
Initial download of the metrics may take a while.