Fig. 3
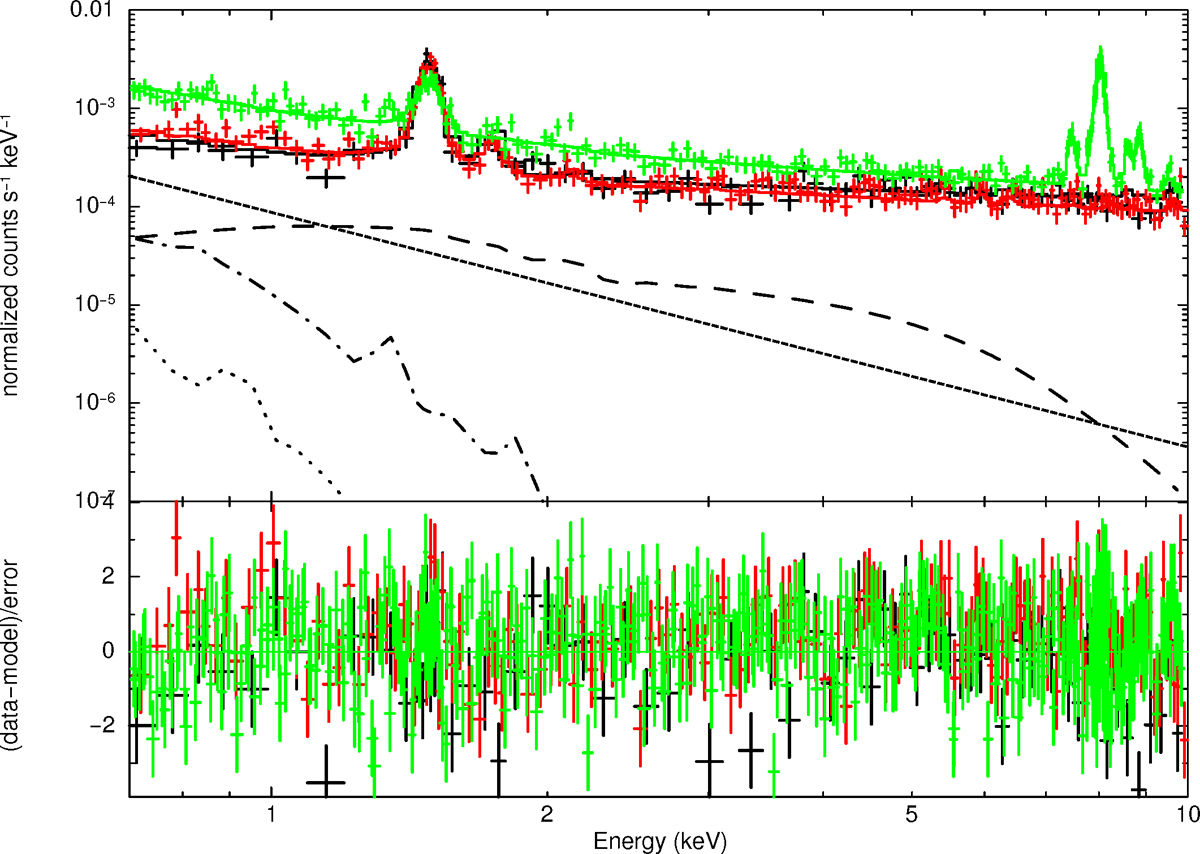
Spectra and best fit models for the XRBG + QPB for MOS1 (black), MOS2 (red), and PN (green) in the region 7′ − 12′. The different components of the XRBG are shown as dotted, dash-dotted, and dashed lines for the local, halo, and CXB component, respectively. The power law component for the residual soft proton emission is shown as short-dashed line. For the spectra and models of the QPB see Fig. 2.
Current usage metrics show cumulative count of Article Views (full-text article views including HTML views, PDF and ePub downloads, according to the available data) and Abstracts Views on Vision4Press platform.
Data correspond to usage on the plateform after 2015. The current usage metrics is available 48-96 hours after online publication and is updated daily on week days.
Initial download of the metrics may take a while.