Fig. 2
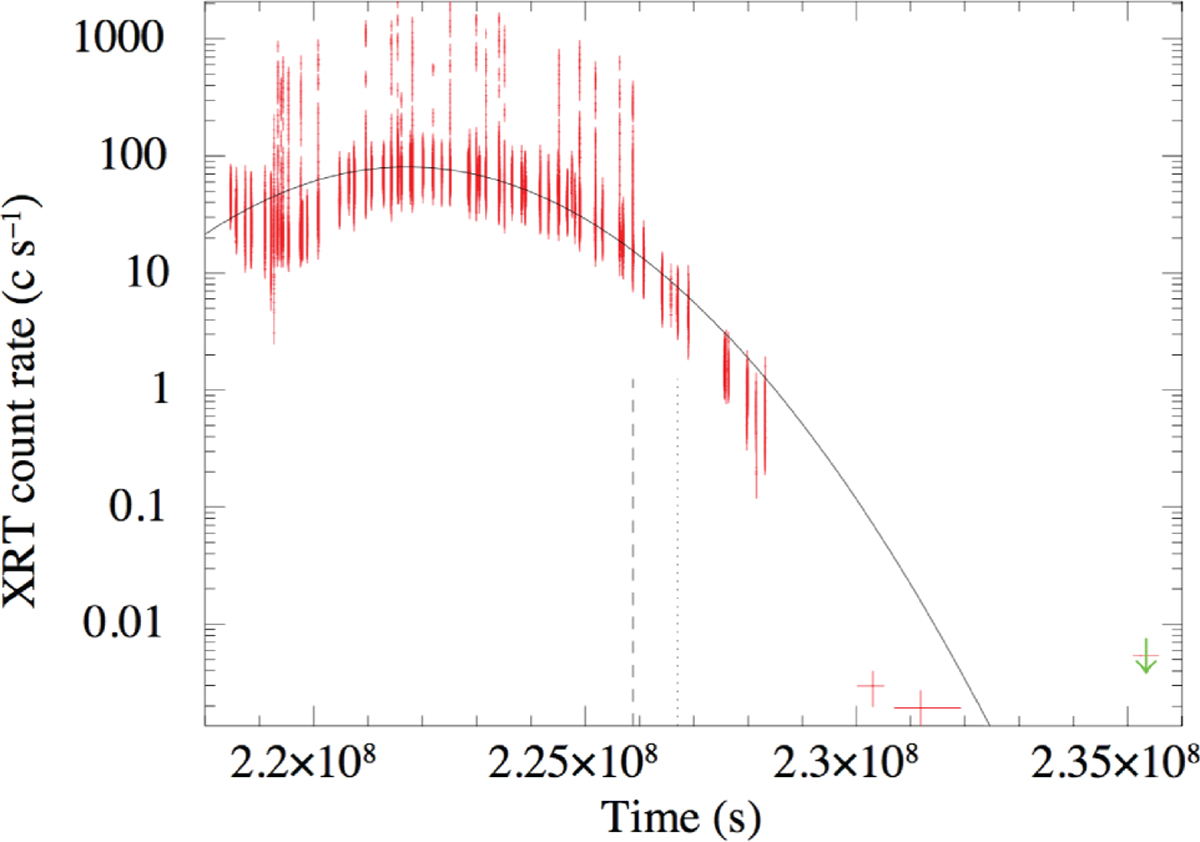
Swift/XRT light curve of the 2014 outburst of GRO 1744–28. Variations in the XRT count rate along each observation are apparent, and the strong flares are due to Type II burst activity (thought to be due to accretion instability at the magnetosphere). The continuous line shows a Gaussian fit to the first part of the outburst (excluding the flaring activity). This fit does not apply to the latest stages of the outburst, which display a steeper decay. The dashed vertical line marks the time at which Type II bursting activity disappeared. The dotted vertical line marks the time at which pulsations were not detected.
Current usage metrics show cumulative count of Article Views (full-text article views including HTML views, PDF and ePub downloads, according to the available data) and Abstracts Views on Vision4Press platform.
Data correspond to usage on the plateform after 2015. The current usage metrics is available 48-96 hours after online publication and is updated daily on week days.
Initial download of the metrics may take a while.