Fig. 4
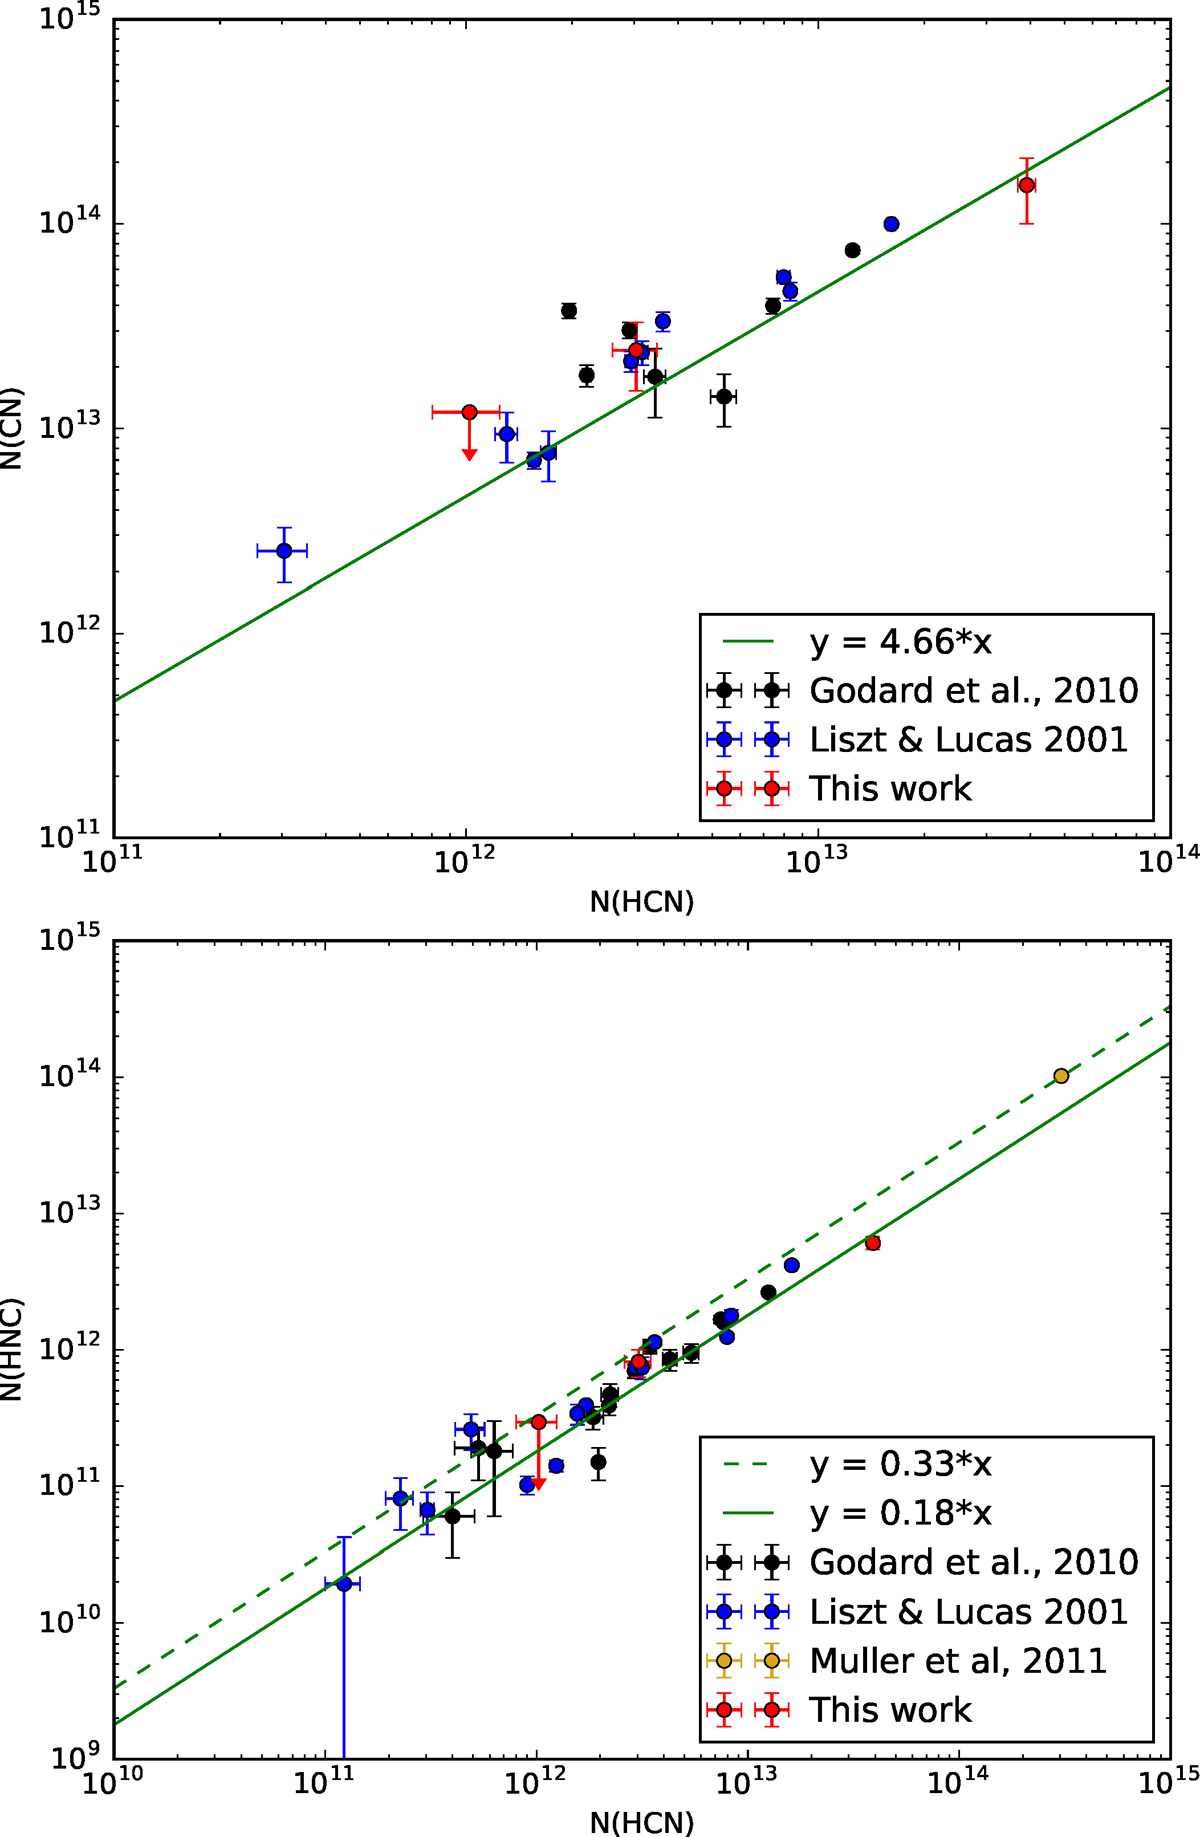
Comparison of the column densities of CN, HCN, and HNC, i.e., the cyanogen- or CN-bearing molecular family. The black symbols correspond to the absorption study against Galactic star-forming regions by Godard et al. (2010), the blue symbols correspond to the absorption study against quasars by Lucas & Liszt (2000a), yellow points refer to the absorption line study of a z = 0.89 galaxy by Muller et al. (2011), and the red symbols correspond to this work. The red points with highest column density correspond to the gas in the Galactic disk (v ~ 0 km s−1), and the red points in the middle correspond to the velocity component of v ~ −153 km s−1. The lower red points refer to the velocity component of v ~−192 km s−1.
Current usage metrics show cumulative count of Article Views (full-text article views including HTML views, PDF and ePub downloads, according to the available data) and Abstracts Views on Vision4Press platform.
Data correspond to usage on the plateform after 2015. The current usage metrics is available 48-96 hours after online publication and is updated daily on week days.
Initial download of the metrics may take a while.