Fig. A.1
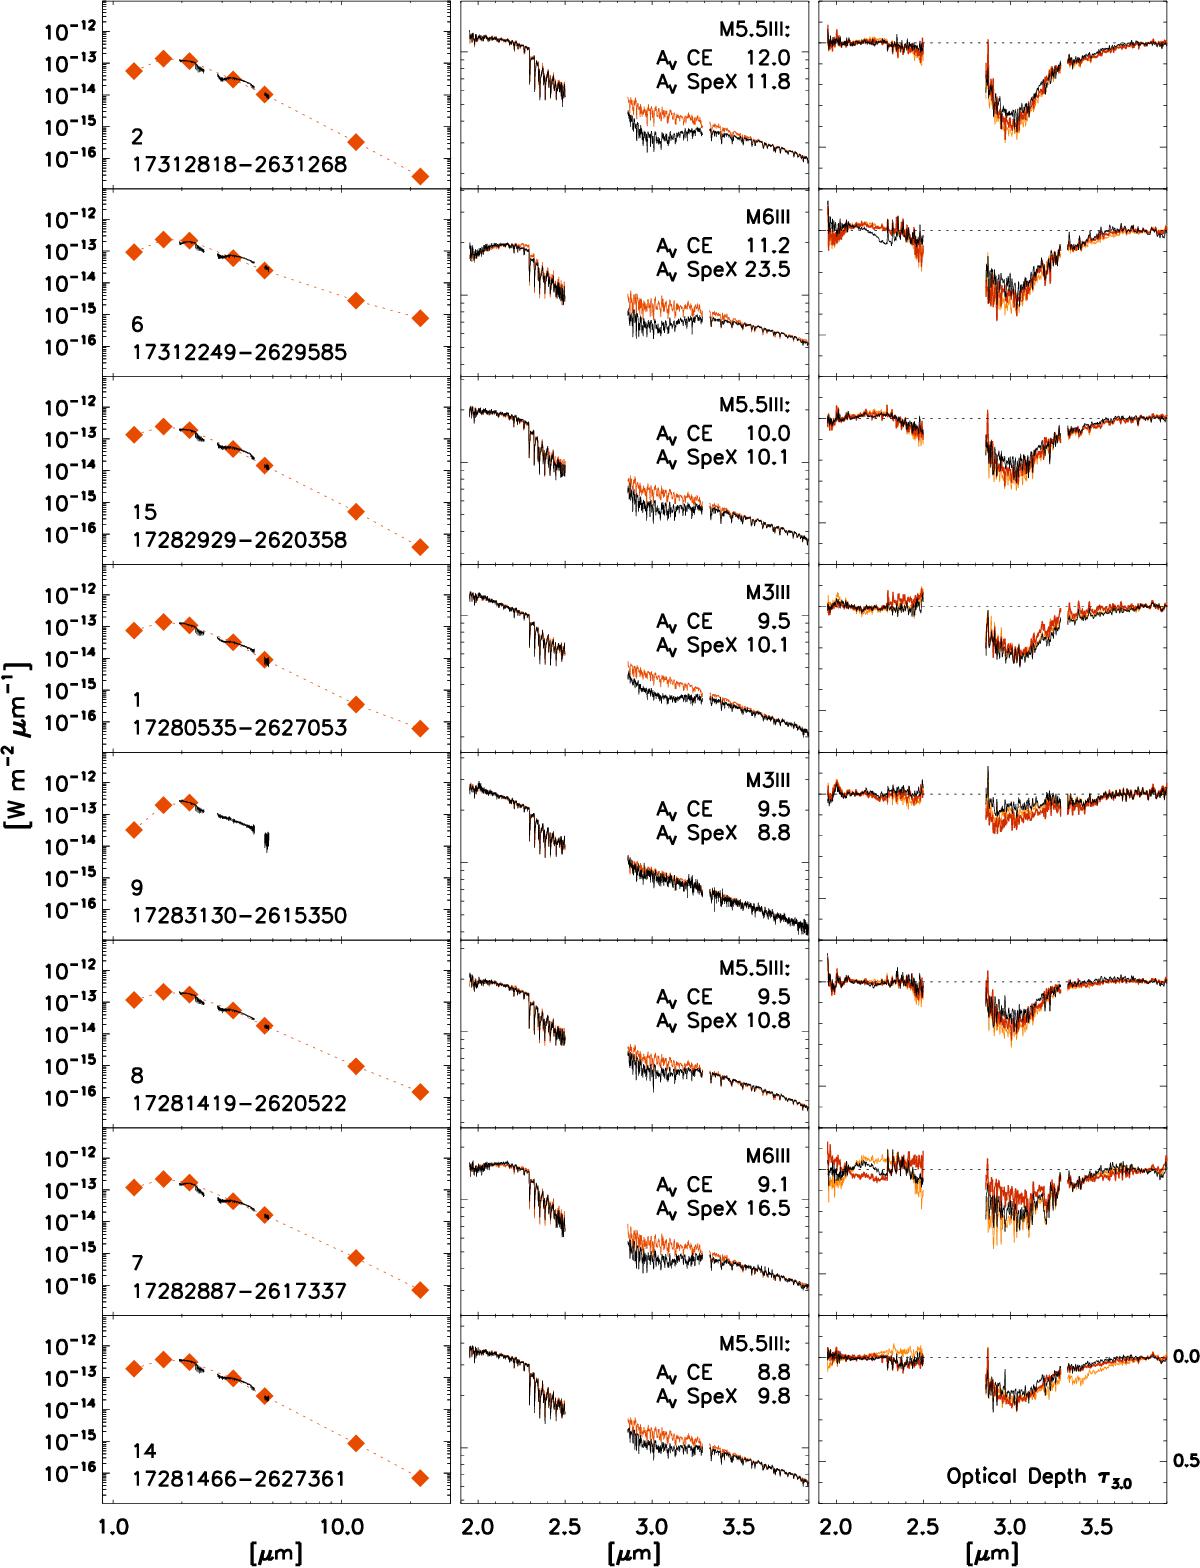
Left: SpeX spectra overlaid with 2MASS and WISE photometry. The identification of the sources in Table 1 and Fig. 1, and the 2MASS names are given at the bottom left. The SpeX spectra are scaled to Ks (2MASS) and W1 (WISE) band photometry, but by multiplying a single factor without adjusting K and L band spectra. Middle: zoom of the spectra from 2.0 to 3.9 μm. The best match template spectrum from IRTF spectral library is shown in orange in background. The excess absorption centered at 3.0 μm is attributed to the water ice. The best match spectral type, the visual extinction as measured by Román-Zúñiga et al. (2010, “CE” for color excess technique), and by matching the template stars (“SpeX”) are shown at the top right. Right: optical depth spectra at 3 μm. The optical depth spectrum calculated with the best matching template is shown in black, the second best in red, and the third best in orange to highlight the systematic uncertainty that stems from the choice of the templates.
Current usage metrics show cumulative count of Article Views (full-text article views including HTML views, PDF and ePub downloads, according to the available data) and Abstracts Views on Vision4Press platform.
Data correspond to usage on the plateform after 2015. The current usage metrics is available 48-96 hours after online publication and is updated daily on week days.
Initial download of the metrics may take a while.