Fig. 2
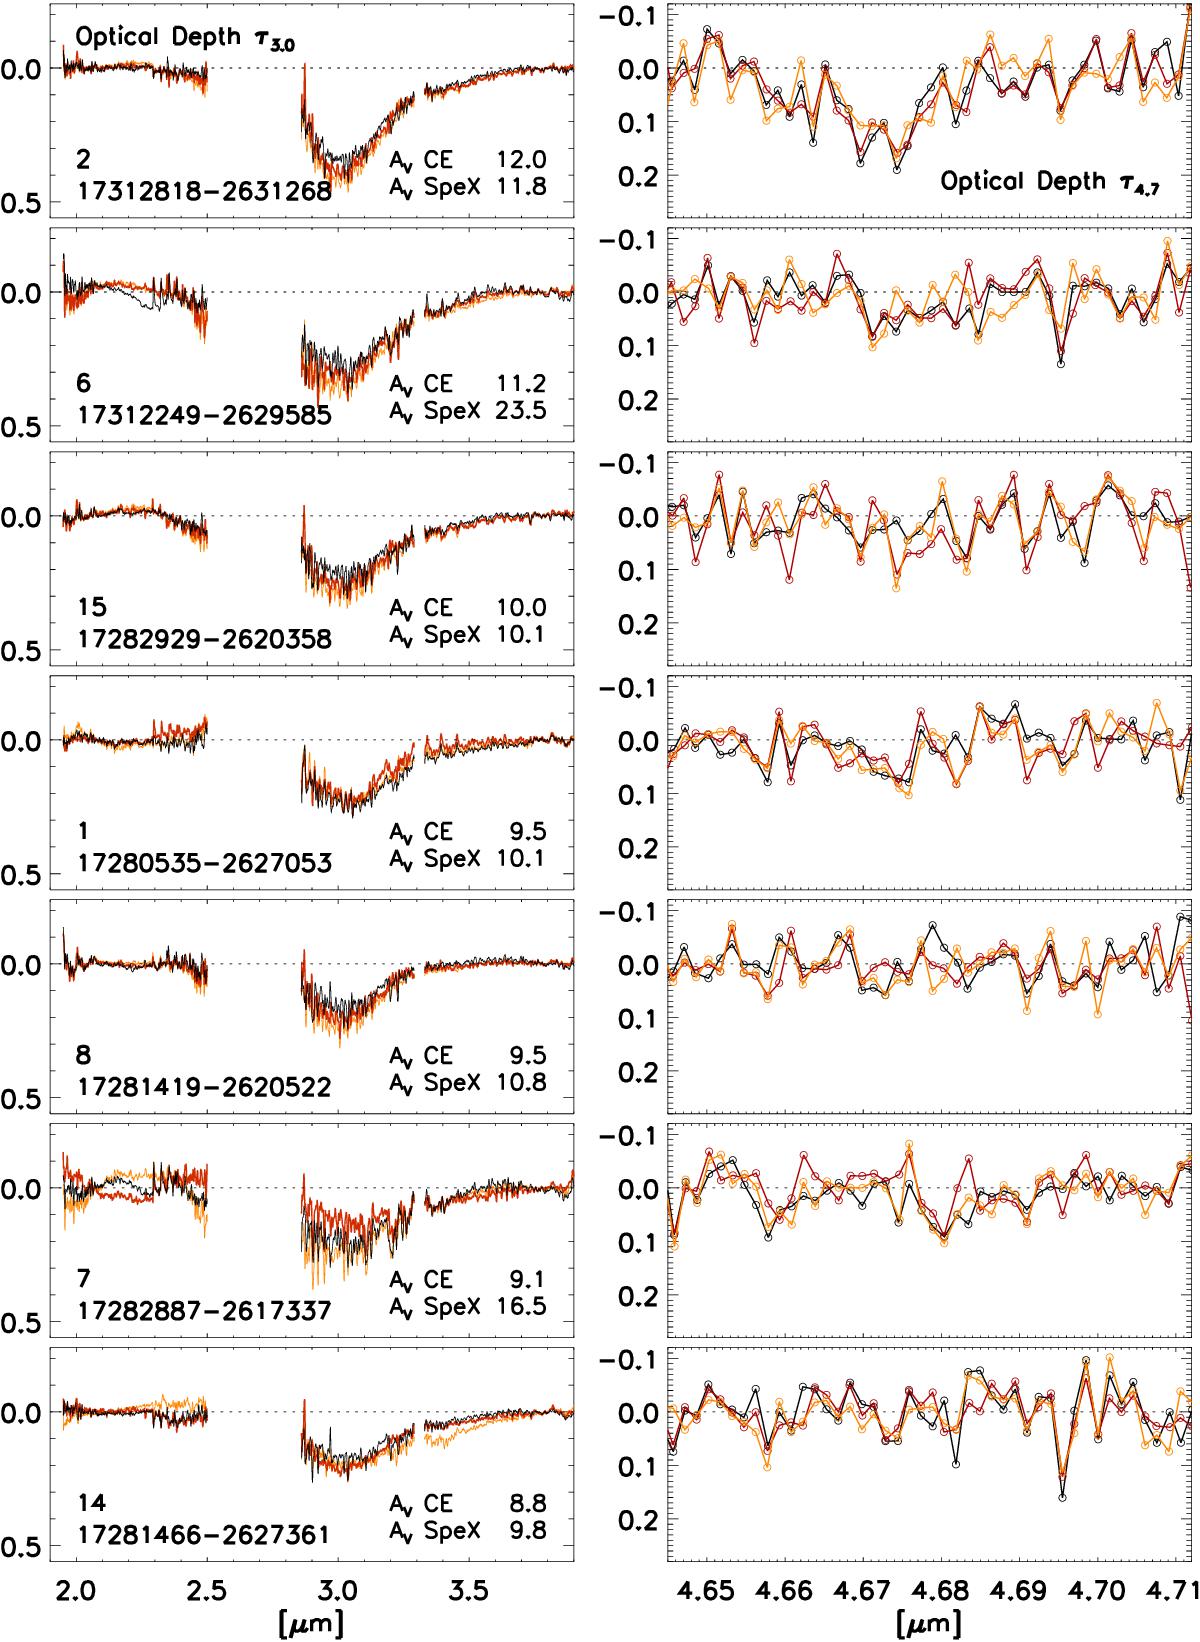
Optical depth spectra of water (3.0 μm; left column) and CO ice (4.672 μm; right column) toward the seven sources where water ice was positively detected in the observations by SpeX spectrograph at the IRTF. The numbering of the sources in Fig. 1 and Table 1 is shown at the bottom left of the water-ice panels with the 2MASS IDs. The CO ice spectra were obtained by NIRSPEC spectrograph at Keck II. The whole SpeX spectra including negative detections are compiled in Fig. A.1. Black, red, and orange plots, are the spectra in which photospheric features are removed by referring to the best, the second best, and the third best matching M-type template stars. The visual extinctions based on the color excess (AV CE; Román-Zúñiga et al. 2010) and on the template matching with the IRTF Spectral Library (AV SpeX; Rayner et al. 2009) are shown at the bottom right of the water ice spectra.
Current usage metrics show cumulative count of Article Views (full-text article views including HTML views, PDF and ePub downloads, according to the available data) and Abstracts Views on Vision4Press platform.
Data correspond to usage on the plateform after 2015. The current usage metrics is available 48-96 hours after online publication and is updated daily on week days.
Initial download of the metrics may take a while.